

CHAPTER 9' Geomorphological and Physical Characteristics of the Bahia Blanca Estuary
209
a
0
24
G 20
L
OJ
a 16
l!!
OJ
a.
E 12
~
8
b
0
35
33
s:
31
Z:~ 29
Iii
Vl
27
I
I
I
25
I
I
I
23
I
5
10
15
Summer
-----------------~----- ---------------------Fall
Spring
-..:..,~~---- ............. ........................... ... .
.....
- ._ .-._._ ._ .- .......
Winter
. . . . ....... ".,;._._._._-- -'- '-'-- - .- .- -
5
89 10111213
14 15 16 17 18
19
10
15
km
------- --- - - - -- - - - - - - -- -5 6 7 8 9 10
11 12 13 14 15
Stations
5
8,
16
km
27
26
25
&
24 Z.;;;
c:
23
~
22
21
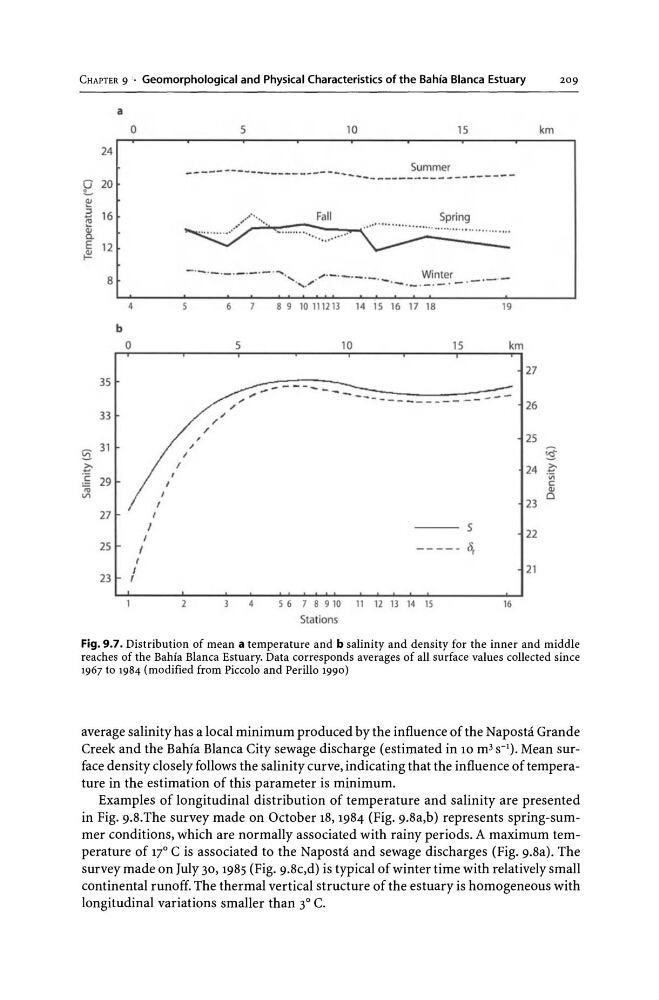
Fig. 9.7. Distribution of mean a temperature and b salinity and density for the inner and middle
reaches of the Bahia Blanca Estuary. Data corresponds averages of all surface values collected since
1967 to 1984 (modified from Piccolo and Perillo 1990)
average salinity has a local minimum produced by the influence of the Naposta Grande
Creek and the Bahia Blanca City sewage discharge (estimated in 10 m3 S-I). Mean surface density closely follows the salinity curve, indicating that the influence of temperature in the estimation of this parameter is minimum.
Examples of longitudinal distribution of temperature and salinity are presented
in Fig. 9.8.The survey made on October 18,1984 (Fig. 9.8a,b) represents spring-summer conditions, which are normally associated with rainy periods. A maximum temperature of 17° C is associated to the Naposta and sewage discharges (Fig. 9.8a). The
survey made on July 30, 1985 (Fig. 9.8c,d) is typical of winter time with relatively small
continental runoff. The thermal vertical structure of the estuary is homogeneous with
longitudinal variations smaller than 3° C.
209
a
0
24
G 20
L
OJ
a 16
l!!
OJ
a.
E 12
~
8
b
0
35
33
s:
31
Z:~ 29
Iii
Vl
27
I
I
I
25
I
I
I
23
I
5
10
15
Summer
-----------------~----- ---------------------Fall
Spring
-..:..,~~---- ............. ........................... ... .
.....
- ._ .-._._ ._ .- .......
Winter
. . . . ....... ".,;._._._._-- -'- '-'-- - .- .- -
5
89 10111213
14 15 16 17 18
19
10
15
km
------- --- - - - -- - - - - - - -- -5 6 7 8 9 10
11 12 13 14 15
Stations
5
8,
16
km
27
26
25
&
24 Z.;;;
c:
23
~
22
21
Fig. 9.7. Distribution of mean a temperature and b salinity and density for the inner and middle
reaches of the Bahia Blanca Estuary. Data corresponds averages of all surface values collected since
1967 to 1984 (modified from Piccolo and Perillo 1990)
average salinity has a local minimum produced by the influence of the Naposta Grande
Creek and the Bahia Blanca City sewage discharge (estimated in 10 m3 S-I). Mean surface density closely follows the salinity curve, indicating that the influence of temperature in the estimation of this parameter is minimum.
Examples of longitudinal distribution of temperature and salinity are presented
in Fig. 9.8.The survey made on October 18,1984 (Fig. 9.8a,b) represents spring-summer conditions, which are normally associated with rainy periods. A maximum temperature of 17° C is associated to the Naposta and sewage discharges (Fig. 9.8a). The
survey made on July 30, 1985 (Fig. 9.8c,d) is typical of winter time with relatively small
continental runoff. The thermal vertical structure of the estuary is homogeneous with
longitudinal variations smaller than 3° C.