

174
M.B. Framiftan . M.P. Etala . E.M. Acha . R. A. Guerrero· C.A. Lasta . O.B. Brown
- 34'
SSurface - FalllWinter
SSUrface - Spring/Summer
-35 '
- 36'
-37 '
-34'
SSottom - FalllW;nter
-35'
-36'
-37'
d
-58'
-57 '
-56'
-55'
-54'
-58'
-57'
- 56'
- 55'
-54'
-53'
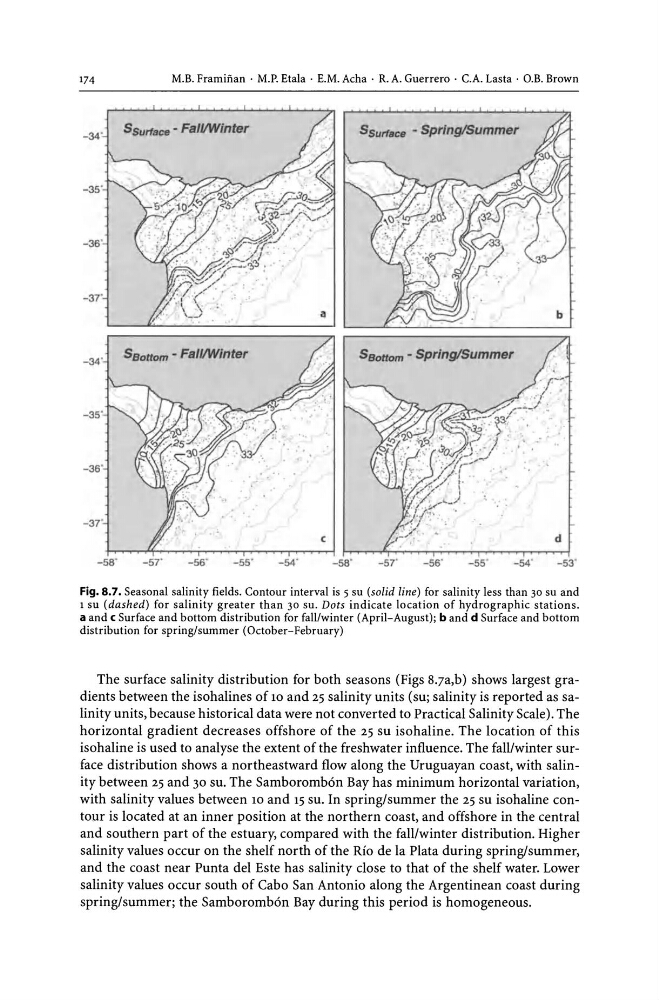
Fig, 8,7, Seasonal salinity fields. Contour interval is 5 su (solid line) for salinity less than 30 su and
1 su (dashed) for salinity greater than 30 suo Dots indicate location of hydrographic stations.
a and c Surface and bottom distribution for fall/winter (April-August); band d Surface and bottom
distribution for spring/summer (October-February)
The surface salinity distribution for both seasons (Figs 8,7a,b) shows largest gradients between the isohalines of 10 and 25 salinity units (su; salinity is reported as salinity units, because historical data were not converted to Practical Salinity Scale), The
horizontal gradient decreases offshore of the 25 su isohaline, The location of this
isohaline is used to analyse the extent of the freshwater influence, The fall/winter surface distribution shows a northeastward flow along the Uruguayan coast, with salinity between 25 and 30 su, The Samboromb6n Bay has minimum horizontal variation,
with salinity values between 10 and 15 su, In spring/summer the 25 su isohaline contour is located at an inner position at the northern coast, and offshore in the central
and southern part of the estuary, compared with the fall/winter distribution, Higher
salinity values occur on the shelf north of the Rio de la Plata during spring/summer,
and the coast near Punta del Este has salinity close to that of the shelf water, Lower
salinity values occur south of Cabo San Antonio along the Argentinean coast during
spring/summer; the Samboromb6n Bay during this period is homogeneous,
M.B. Framiftan . M.P. Etala . E.M. Acha . R. A. Guerrero· C.A. Lasta . O.B. Brown
- 34'
SSurface - FalllWinter
SSUrface - Spring/Summer
-35 '
- 36'
-37 '
-34'
SSottom - FalllW;nter
-35'
-36'
-37'
d
-58'
-57 '
-56'
-55'
-54'
-58'
-57'
- 56'
- 55'
-54'
-53'
Fig, 8,7, Seasonal salinity fields. Contour interval is 5 su (solid line) for salinity less than 30 su and
1 su (dashed) for salinity greater than 30 suo Dots indicate location of hydrographic stations.
a and c Surface and bottom distribution for fall/winter (April-August); band d Surface and bottom
distribution for spring/summer (October-February)
The surface salinity distribution for both seasons (Figs 8,7a,b) shows largest gradients between the isohalines of 10 and 25 salinity units (su; salinity is reported as salinity units, because historical data were not converted to Practical Salinity Scale), The
horizontal gradient decreases offshore of the 25 su isohaline, The location of this
isohaline is used to analyse the extent of the freshwater influence, The fall/winter surface distribution shows a northeastward flow along the Uruguayan coast, with salinity between 25 and 30 su, The Samboromb6n Bay has minimum horizontal variation,
with salinity values between 10 and 15 su, In spring/summer the 25 su isohaline contour is located at an inner position at the northern coast, and offshore in the central
and southern part of the estuary, compared with the fall/winter distribution, Higher
salinity values occur on the shelf north of the Rio de la Plata during spring/summer,
and the coast near Punta del Este has salinity close to that of the shelf water, Lower
salinity values occur south of Cabo San Antonio along the Argentinean coast during
spring/summer; the Samboromb6n Bay during this period is homogeneous,