

CHAPTER 8 · Physical Characteristics and Processes of the Rio de la Plata Estuary
173
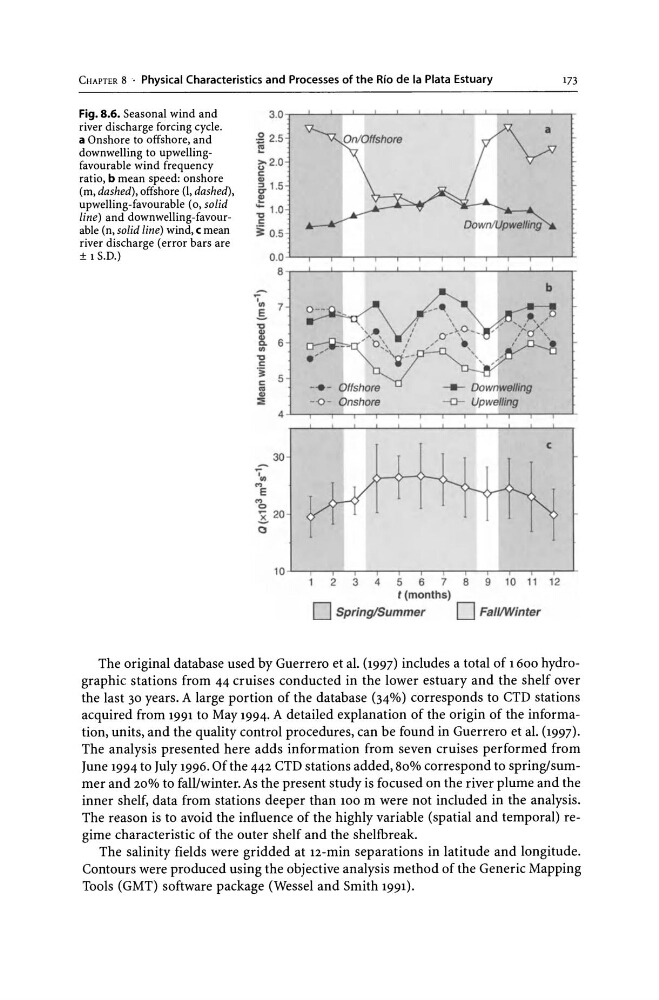
Fig. 8.6. Seasonal wind and
river discharge forcing cycle.
a Onshore to offshore, and
downwelling to upwellingfavourable wind frequency
ratio, b mean speed: onshore
(m, dashed), offshore (I, dashed) ,
upwelling-favourable (0, solid
line) and downwelling-favourable (n, solid line) wind, c mean
river discharge (error bars are
± 1 S.D.)
.g 2.5
~
a
O.O-'--'---'--.---r-r--'---'--.---r-r--'---'~
e.-~~_L-~~ __ L-~~ __ L-J-~ __ L-T
'",
§.
.., ., .,
Cl.
U>
.., c:
"i
c:
. .
.,
:::;;;
, .,
... E
'"b
7
6
5
4
30
~ 20
(3
Onshore
c
2
3
4
5
6
7
e 9 10 11 12
t (months)
D Spring/Summer D Fal//winter
The original database used by Guerrero et al. (1997) includes a total of 1600 hydrographic stations from 44 cruises conducted in the lower estuary and the shelf over
the last 30 years. A large portion of the database (34%) corresponds to CTD stations
acquired from 1991 to May 1994. A detailed explanation of the origin of the information, units, and the quality control procedures, can be found in Guerrero et al. (1997).
The analysis presented here adds information from seven cruises performed from
June 1994 to July 1996. Of the 442 CTD stations added, 80% correspond to spring/summer and 20% to fall/winter. As the present study is focused on the river plume and the
inner shelf, data from stations deeper than 100 m were not included in the analysis.
The reason is to avoid the influence of the highly variable (spatial and temporal) regime characteristic of the outer shelf and the shelfbreak.
The salinity fields were gridded at 12-min separations in latitude and longitude.
Contours were produced using the objective analysis method of the Generic Mapping
Tools (GMT) software package (Wessel and Smith 1991).
173
Fig. 8.6. Seasonal wind and
river discharge forcing cycle.
a Onshore to offshore, and
downwelling to upwellingfavourable wind frequency
ratio, b mean speed: onshore
(m, dashed), offshore (I, dashed) ,
upwelling-favourable (0, solid
line) and downwelling-favourable (n, solid line) wind, c mean
river discharge (error bars are
± 1 S.D.)
.g 2.5
~
a
O.O-'--'---'--.---r-r--'---'--.---r-r--'---'~
e.-~~_L-~~ __ L-~~ __ L-J-~ __ L-T
'",
§.
.., ., .,
Cl.
U>
.., c:
"i
c:
. .
.,
:::;;;
, .,
... E
'"b
7
6
5
4
30
~ 20
(3
Onshore
c
2
3
4
5
6
7
e 9 10 11 12
t (months)
D Spring/Summer D Fal//winter
The original database used by Guerrero et al. (1997) includes a total of 1600 hydrographic stations from 44 cruises conducted in the lower estuary and the shelf over
the last 30 years. A large portion of the database (34%) corresponds to CTD stations
acquired from 1991 to May 1994. A detailed explanation of the origin of the information, units, and the quality control procedures, can be found in Guerrero et al. (1997).
The analysis presented here adds information from seven cruises performed from
June 1994 to July 1996. Of the 442 CTD stations added, 80% correspond to spring/summer and 20% to fall/winter. As the present study is focused on the river plume and the
inner shelf, data from stations deeper than 100 m were not included in the analysis.
The reason is to avoid the influence of the highly variable (spatial and temporal) regime characteristic of the outer shelf and the shelfbreak.
The salinity fields were gridded at 12-min separations in latitude and longitude.
Contours were produced using the objective analysis method of the Generic Mapping
Tools (GMT) software package (Wessel and Smith 1991).