

CHAPTER 7' Hydrography and Sediment Transport Characteristics of the Rio de la Plata
153
Nagy et a1. (1987) located the turbidity maximum between Punta Yeguas and Punta
Espinillo transverse sections (see Fig. 7.12 as an example). This location agrees with
satellite data (Gagliardini et a1. 1984; Karszenbaun et a1. 1983; Jackson 1984; Ayup 1987;
Nagy 1989), which shows a discontinuous surface distribution of turbidity associated
with the frontal area of mixing, where a large portion of the transported solids flocculate (Fig. 7.13). This feature is also reflected in the morphology (Barra del Indio) and
in the bottom sediment distribution. Two well defined facies can be found in the area:
onlap marine sands and offlap clayey silts.
Lopez Laborde et a1. (1991) analysed suspended sediment behaviour during three
tidal cycles at an anchored station (Fig. 7.10), concluding that suspended sediment
dynamics it is controlled by tidal friction and by salinity induced physico-chemical
processes.
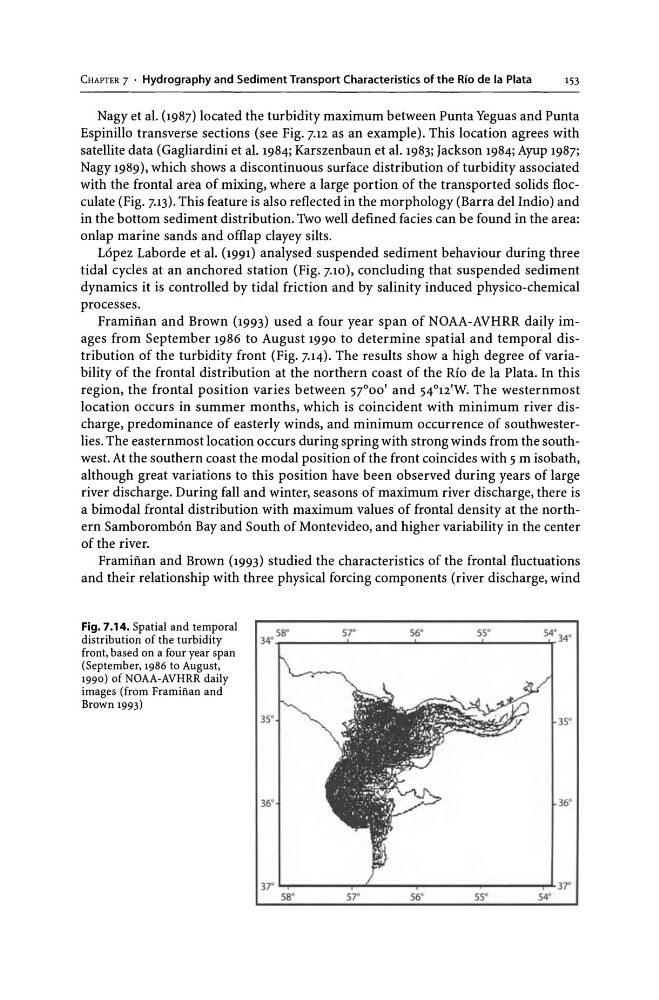
Framifian and Brown (1993) used a four year span of NOAA-AVHRR daily images from September 1986 to August 1990 to determine spatial and temporal distribution of the turbidity front (Fig. 7.14). The results show a high degree of variability of the frontal distribution at the northern coast of the Rio de la Plata. In this
region, the frontal position varies between 57°00' and 54°12'W. The westernmost
location occurs in summer months, which is coincident with minimum river discharge, predominance of easterly winds, and minimum occurrence of southwesterlies. The easternmost location occurs during spring with strong winds from the southwest. At the southern coast the modal position of the front coincides with 5 m isobath,
although great variations to this position have been observed during years of large
river discharge. During fall and winter, seasons of maximum river discharge, there is
a bimodal frontal distribution with maximum values of frontal density at the northern Samborombon Bay and South of Montevideo, and higher variability in the center
of the river.
Framifian and Brown (1993) studied the characteristics of the frontal fluctuations
and their relationship with three physical forcing components (river discharge, wind
Fig. 7.14. Spatial and temporal
distribution of the turbidity
front, based on a four year span
(September, 1986 to August,
1990) of NOAA-AVHRR daily
images (from Framiiian and
Brown 1993)
34. '\" 58 _· _ _ _ _ 5 ... 7' _ _ _ _ 5 .... 6_ · _ _ _ _ 5 .... 5· _ _ _ _ 5.,..4 · 34'
35'
35'
36'
37' ~---~~---~---~---~ 37'
58'
57'
56'
55'
54'
153
Nagy et a1. (1987) located the turbidity maximum between Punta Yeguas and Punta
Espinillo transverse sections (see Fig. 7.12 as an example). This location agrees with
satellite data (Gagliardini et a1. 1984; Karszenbaun et a1. 1983; Jackson 1984; Ayup 1987;
Nagy 1989), which shows a discontinuous surface distribution of turbidity associated
with the frontal area of mixing, where a large portion of the transported solids flocculate (Fig. 7.13). This feature is also reflected in the morphology (Barra del Indio) and
in the bottom sediment distribution. Two well defined facies can be found in the area:
onlap marine sands and offlap clayey silts.
Lopez Laborde et a1. (1991) analysed suspended sediment behaviour during three
tidal cycles at an anchored station (Fig. 7.10), concluding that suspended sediment
dynamics it is controlled by tidal friction and by salinity induced physico-chemical
processes.
Framifian and Brown (1993) used a four year span of NOAA-AVHRR daily images from September 1986 to August 1990 to determine spatial and temporal distribution of the turbidity front (Fig. 7.14). The results show a high degree of variability of the frontal distribution at the northern coast of the Rio de la Plata. In this
region, the frontal position varies between 57°00' and 54°12'W. The westernmost
location occurs in summer months, which is coincident with minimum river discharge, predominance of easterly winds, and minimum occurrence of southwesterlies. The easternmost location occurs during spring with strong winds from the southwest. At the southern coast the modal position of the front coincides with 5 m isobath,
although great variations to this position have been observed during years of large
river discharge. During fall and winter, seasons of maximum river discharge, there is
a bimodal frontal distribution with maximum values of frontal density at the northern Samborombon Bay and South of Montevideo, and higher variability in the center
of the river.
Framifian and Brown (1993) studied the characteristics of the frontal fluctuations
and their relationship with three physical forcing components (river discharge, wind
Fig. 7.14. Spatial and temporal
distribution of the turbidity
front, based on a four year span
(September, 1986 to August,
1990) of NOAA-AVHRR daily
images (from Framiiian and
Brown 1993)
34. '\" 58 _· _ _ _ _ 5 ... 7' _ _ _ _ 5 .... 6_ · _ _ _ _ 5 .... 5· _ _ _ _ 5.,..4 · 34'
35'
35'
36'
37' ~---~~---~---~---~ 37'
58'
57'
56'
55'
54'