

64
2 Analytical Properties
(2) The suspected outlier (Xq) is identified.
(3) Ocal is calculated from the expression Ocal = I Xq - nearest value l/span.
(4) The Ocal va lue thus obtained is compared with a tabulated value Ot at a given significance level and number of data in the set.
Data
n
4
5
6
7
8
9
10
90% conf. Ot 0.76
0.64
0.56
0.5 1
0.47
0.44
0.41
95% conf. Ot
0.831
0.717 0.621
0.570
0.524
0.492
0.464
(B) THE LIMIT OF CONFIDENCE CRITERION uses the following procedure:
_
_ S
(1) X and 5 are ca lculated from all available data and the limits of confidence,X t rn ,at a
given probability level are established.
n
(2) If the suspected outlier,xq,does not fall within the interval, then it should be rejected
and statistics recalculated.
This criterion has the disadvantage that, because it uses the outlier for calcu lation, it
expands the limits artificially - particularly if n is small.
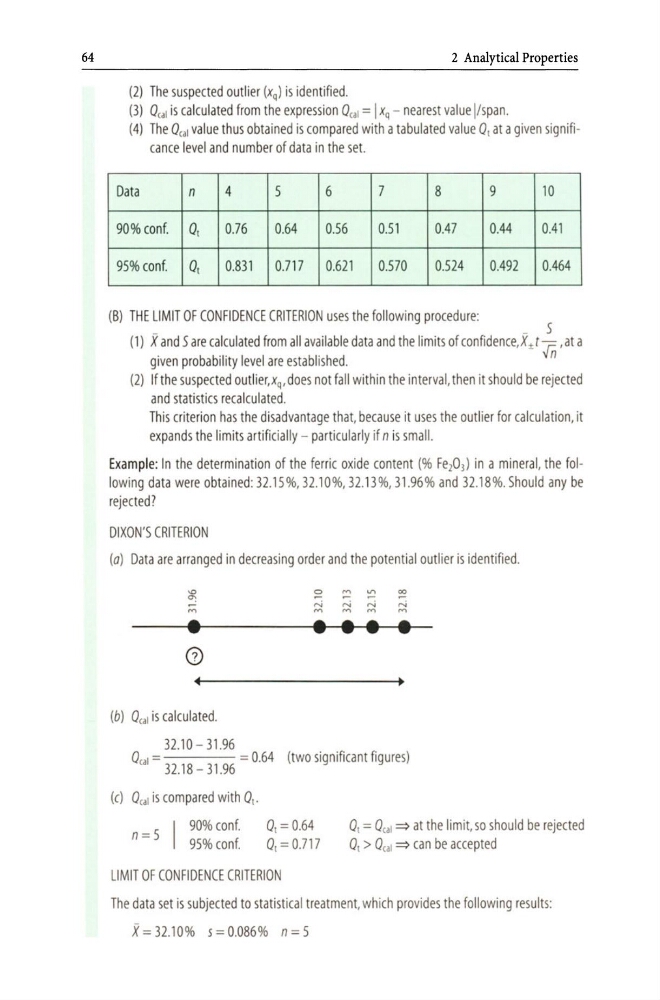
Example: In the determination of the ferric oxide content (% Fe203) in a mineral, the following data were obtained: 32.15%, 32.10%, 32.13 %, 31 .96% and 32.18%. Should any be
rejected?
DIXON'S CRITERION
(a) Data are arranged in decreasing order and the potential outlier is identified.
-0
~
,..,
•
G)
4
(b) Ocal is calculated.
32.10 - 31 .96
~
N
'"
•
,.., '" ~
N
N
N
'" '" '"
• • •
•
o 1=
= 0.64 (two significant figures)
ca 32.18-31.96
(e) Ocal is compared with Ot.
n = 5 I 90% conf.
95% conf.
Ot = 0.64
Ot = 0.717
LIMIT OF CONFIDENCE CRITERION
Ot = Ocal ::::) at the limit, so should be rejected
Ot > Ocal ::::) can be accepted
The data set is subjected to statistical treatment, which provides the following results:
X= 32.10% 5= 0.086% n=5
2 Analytical Properties
(2) The suspected outlier (Xq) is identified.
(3) Ocal is calculated from the expression Ocal = I Xq - nearest value l/span.
(4) The Ocal va lue thus obtained is compared with a tabulated value Ot at a given significance level and number of data in the set.
Data
n
4
5
6
7
8
9
10
90% conf. Ot 0.76
0.64
0.56
0.5 1
0.47
0.44
0.41
95% conf. Ot
0.831
0.717 0.621
0.570
0.524
0.492
0.464
(B) THE LIMIT OF CONFIDENCE CRITERION uses the following procedure:
_
_ S
(1) X and 5 are ca lculated from all available data and the limits of confidence,X t rn ,at a
given probability level are established.
n
(2) If the suspected outlier,xq,does not fall within the interval, then it should be rejected
and statistics recalculated.
This criterion has the disadvantage that, because it uses the outlier for calcu lation, it
expands the limits artificially - particularly if n is small.
Example: In the determination of the ferric oxide content (% Fe203) in a mineral, the following data were obtained: 32.15%, 32.10%, 32.13 %, 31 .96% and 32.18%. Should any be
rejected?
DIXON'S CRITERION
(a) Data are arranged in decreasing order and the potential outlier is identified.
-0
~
,..,
•
G)
4
(b) Ocal is calculated.
32.10 - 31 .96
~
N
'"
•
,.., '" ~
N
N
N
'" '" '"
• • •
•
o 1=
= 0.64 (two significant figures)
ca 32.18-31.96
(e) Ocal is compared with Ot.
n = 5 I 90% conf.
95% conf.
Ot = 0.64
Ot = 0.717
LIMIT OF CONFIDENCE CRITERION
Ot = Ocal ::::) at the limit, so should be rejected
Ot > Ocal ::::) can be accepted
The data set is subjected to statistical treatment, which provides the following results:
X= 32.10% 5= 0.086% n=5