

128
3 Traceability: Reference Materials
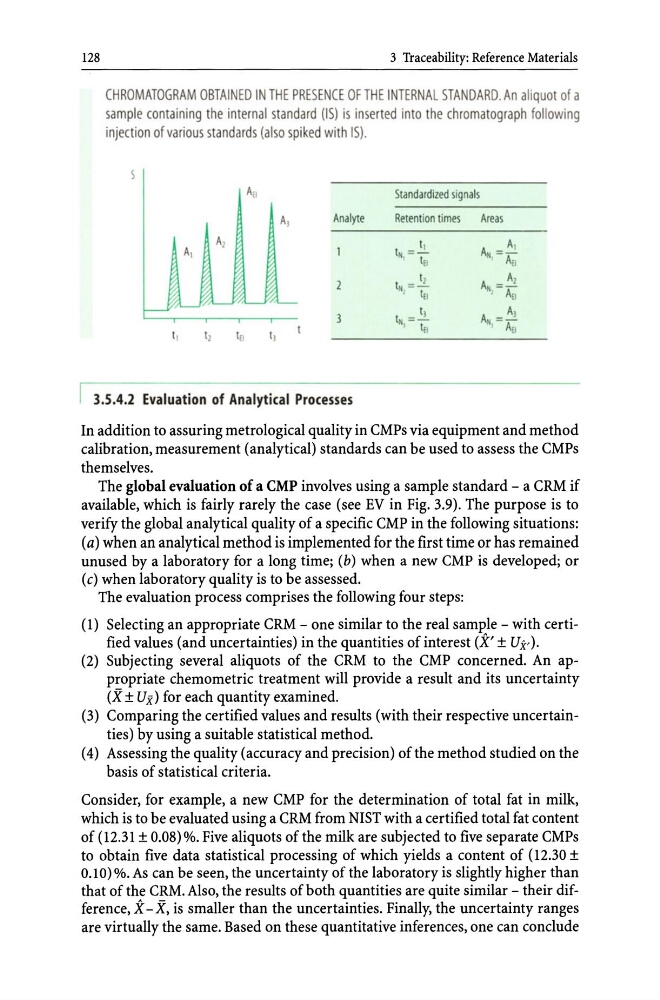
CHROMATOGRAM OBTAINED IN THE PRESENCE OF TH E INTERNAL STANDARD. An aliquot of a
sample containing the internal standard (IS) is inserted into the chromatograph following
injection of various standards (also spiked with IS).
Au
Standardized signals
Al
Analyte
Retention times
Areas
Al
I,
= ~
A,
IN = -
A
te
t}
A;. = Al
lH =f-------JL-.1
' tn
l
Au
" -
Al
tl
tH= -
AN = -
tl
tl
til
tl
tE l
AD
3.5.4.2 Evaluation of Analytical Processes
In addition to assuring metrological quality in CMPs via equipment and method
calibration, measurement (analytical) standards can be used to assess the CMPs
themselves.
The global evaluation of a CMP involves using a sample standard - a CRM if
available, which is fairly rarely the case (see EV in Fig. 3.9). The purpose is to
verify the global analytical quality of a specific CMP in the following situations:
(a) when an analytical method is implemented for the first time or has remained
unused by a laboratory for a long time; (b) when a new CMP is developed; or
(c) when laboratory quality is to be assessed.
The evaluation process comprises the following four steps:
(1) Selecting an appropriate CRM - one similar to the real sample - with certified values (and uncertainties) in the quantities of interest (X' ± Ux,),
(2) Subjecting several aliquots of the CRM to the CMP concerned. An appropriate chemometric treatment will provide a result and its uncertainty
eX ± Ux) for each quantity examined.
(3) Comparing the certified values and results (with their respective uncertainties) by using a suitable statistical method.
(4) Assessing the quality (accuracy and precision) of the method studied on the
basis of statistical criteria.
Consider, for example, a new CMP for the determination of total fat in milk,
which is to be evaluated using a CRM from NIST with a certified total fat content
of (12.31 ± 0.08) %. Five aliquots of the milk are subjected to five separate CMPs
to obtain five data statistical processing of which yields a content of (12.30 ±
0.10) %. As can be seen, the uncertainty of the laboratory is slightly higher than
that of the CRM. Also, the results of both quantities are quite similar - their difference, X-X, is smaller than the uncertainties. Finally, the uncertainty ranges
are virtually the same. Based on these quantitative inferences, one can conclude
3 Traceability: Reference Materials
CHROMATOGRAM OBTAINED IN THE PRESENCE OF TH E INTERNAL STANDARD. An aliquot of a
sample containing the internal standard (IS) is inserted into the chromatograph following
injection of various standards (also spiked with IS).
Au
Standardized signals
Al
Analyte
Retention times
Areas
Al
I,
= ~
A,
IN = -
A
te
t}
A;. = Al
lH =f-------JL-.1
' tn
l
Au
" -
Al
tl
tH= -
AN = -
tl
tl
til
tl
tE l
AD
3.5.4.2 Evaluation of Analytical Processes
In addition to assuring metrological quality in CMPs via equipment and method
calibration, measurement (analytical) standards can be used to assess the CMPs
themselves.
The global evaluation of a CMP involves using a sample standard - a CRM if
available, which is fairly rarely the case (see EV in Fig. 3.9). The purpose is to
verify the global analytical quality of a specific CMP in the following situations:
(a) when an analytical method is implemented for the first time or has remained
unused by a laboratory for a long time; (b) when a new CMP is developed; or
(c) when laboratory quality is to be assessed.
The evaluation process comprises the following four steps:
(1) Selecting an appropriate CRM - one similar to the real sample - with certified values (and uncertainties) in the quantities of interest (X' ± Ux,),
(2) Subjecting several aliquots of the CRM to the CMP concerned. An appropriate chemometric treatment will provide a result and its uncertainty
eX ± Ux) for each quantity examined.
(3) Comparing the certified values and results (with their respective uncertainties) by using a suitable statistical method.
(4) Assessing the quality (accuracy and precision) of the method studied on the
basis of statistical criteria.
Consider, for example, a new CMP for the determination of total fat in milk,
which is to be evaluated using a CRM from NIST with a certified total fat content
of (12.31 ± 0.08) %. Five aliquots of the milk are subjected to five separate CMPs
to obtain five data statistical processing of which yields a content of (12.30 ±
0.10) %. As can be seen, the uncertainty of the laboratory is slightly higher than
that of the CRM. Also, the results of both quantities are quite similar - their difference, X-X, is smaller than the uncertainties. Finally, the uncertainty ranges
are virtually the same. Based on these quantitative inferences, one can conclude