

94
2 Analytical Properties
% confidence
90%
95%
98%
99%
±U ...
0.013
0.016
0.022
0.026
± UB
0.047
0.060
0.078
0.094
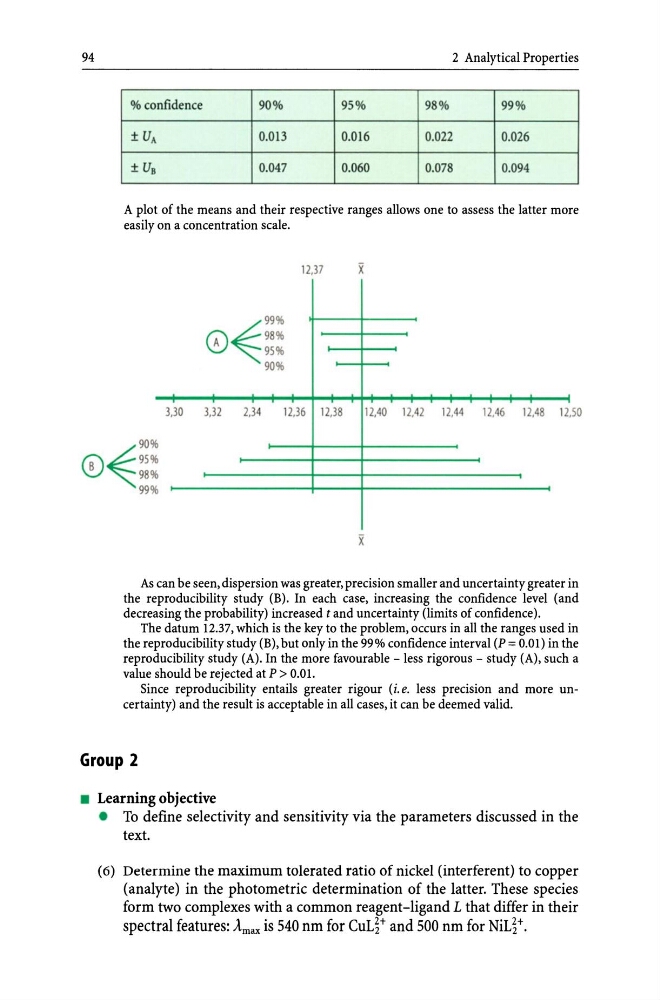
A plot of the means and their respective ranges allows one to assess the latter more
easily on a concentration scale.
12.37
X
~ ~.
CD 98%
95%
90%
3.30
3.32
2.34
12.36 12.38
12,40 12.42 12.44
12,46 12,48 12. so
90%
f B \ / 95%
\V~ 98%
99%
As can be seen, dispersion was greater, precision smaller and uncertainty greater in
the reproducibility study (B). In each case, increasing the confidence level (and
decreasing the probability) increased t and uncertainty (limits of confidence).
The datum 12.37, which is the key to the problem, occurs in all the ranges used in
the reproducibility study (B), but only in the 99% confidence interval (P = 0.01) in the
reproducibility study (A). In the more favourable - less rigorous - study (A), such a
value should be rejected at P > 0.01.
Since reproducibility entails greater rigour (i. e. less precision and more uncertainty) and the result is acceptable in all cases, it can be deemed valid.
Group 2
• Learning objective
• To define selectivity and sensitivity via the parameters discussed in the
text.
(6) Determine the maximum tolerated ratio of nickel (interferent) to copper
(analyte) in the photometric determination of the latter. These species
form two complexes with a common reagent-ligand L that differ in their
spectral features: Amax is 540 nm for CuL~+ and 500 nm for NiL~+.
2 Analytical Properties
% confidence
90%
95%
98%
99%
±U ...
0.013
0.016
0.022
0.026
± UB
0.047
0.060
0.078
0.094
A plot of the means and their respective ranges allows one to assess the latter more
easily on a concentration scale.
12.37
X
~ ~.
CD 98%
95%
90%
3.30
3.32
2.34
12.36 12.38
12,40 12.42 12.44
12,46 12,48 12. so
90%
f B \ / 95%
\V~ 98%
99%
As can be seen, dispersion was greater, precision smaller and uncertainty greater in
the reproducibility study (B). In each case, increasing the confidence level (and
decreasing the probability) increased t and uncertainty (limits of confidence).
The datum 12.37, which is the key to the problem, occurs in all the ranges used in
the reproducibility study (B), but only in the 99% confidence interval (P = 0.01) in the
reproducibility study (A). In the more favourable - less rigorous - study (A), such a
value should be rejected at P > 0.01.
Since reproducibility entails greater rigour (i. e. less precision and more uncertainty) and the result is acceptable in all cases, it can be deemed valid.
Group 2
• Learning objective
• To define selectivity and sensitivity via the parameters discussed in the
text.
(6) Determine the maximum tolerated ratio of nickel (interferent) to copper
(analyte) in the photometric determination of the latter. These species
form two complexes with a common reagent-ligand L that differ in their
spectral features: Amax is 540 nm for CuL~+ and 500 nm for NiL~+.