

Seminars: Numerical Problems
93
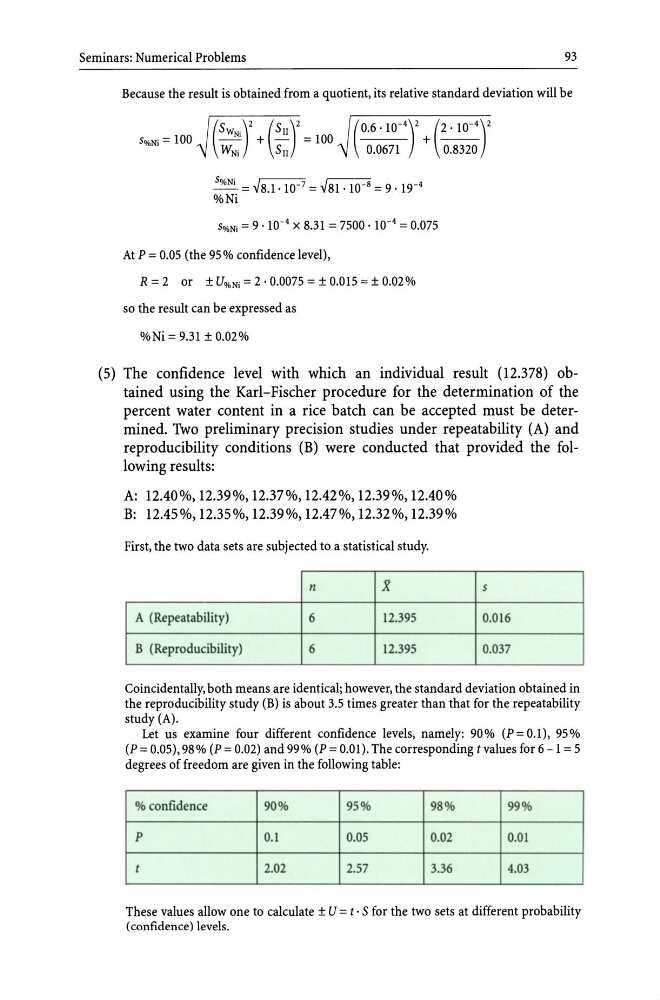
Because the result is obtained from a quotient, its relative standard deviation will be
( SWN;)2 (Sn)2
-
+ -
=100
WNi
Sn
(
0.6. 10- 4 )2 + (~)2
0.0671
0.8320
S%Ni = 100
S%Ni = ~8.1.1O-7 = ~81.1O-8 = 9 . 19- 4
%Ni
S%Ni = 9 . 10- 4 X 8.31 = 7500· 10- 4 = 0.075
At P = 0.05 (the 95% confidence level),
R = 2 or ± U%Ni = 2 · 0.0075 = ± 0.015 '" ± 0.02%
so the result can be expressed as
%Ni = 9.31 ± 0.02%
(5) The confidence level with which an individual result (12.378) obtained using the Karl-Fischer procedure for the determination of the
percent water content in a rice batch can be accepted must be determined. Two preliminary precision studies under repeatability (A) and
reproducibility conditions (B) were conducted that provided the following results:
A: 12.40%,12.39%,12.37%,12.42%,12.39%,12.40%
B: 12.45%,12.35%,12.39%,12.47%,12.32%,12.39%
First, the two data sets are subjected to a statistical study.
n
X
A (Repeatability)
6
12.395
B (Reproducibility)
6
12.395
s
0.016
0.037
Coincidentally, both means are identical; however, the standard deviation obtained in
the reproducibility study (B) is about 3.5 times greater than that for the repeatability
study (A).
Let us examine four different confidence levels, namely: 90% (P = 0.1), 95%
(P = 0.05), 98% (P = 0.02) and 99% (P = 0.01). The corresponding tvalues for 6 -1 = 5
degrees of freedom are given in the following table:
% confidence
90%
95 %
98 %
99 %
P
0.1
0.05
0.Q2
0.01
t
2.02
2.57
3.36
4.03
These values allow one to calculate ± U = t · S for the two sets at different probability
(confidence) levels.
93
Because the result is obtained from a quotient, its relative standard deviation will be
( SWN;)2 (Sn)2
-
+ -
=100
WNi
Sn
(
0.6. 10- 4 )2 + (~)2
0.0671
0.8320
S%Ni = 100
S%Ni = ~8.1.1O-7 = ~81.1O-8 = 9 . 19- 4
%Ni
S%Ni = 9 . 10- 4 X 8.31 = 7500· 10- 4 = 0.075
At P = 0.05 (the 95% confidence level),
R = 2 or ± U%Ni = 2 · 0.0075 = ± 0.015 '" ± 0.02%
so the result can be expressed as
%Ni = 9.31 ± 0.02%
(5) The confidence level with which an individual result (12.378) obtained using the Karl-Fischer procedure for the determination of the
percent water content in a rice batch can be accepted must be determined. Two preliminary precision studies under repeatability (A) and
reproducibility conditions (B) were conducted that provided the following results:
A: 12.40%,12.39%,12.37%,12.42%,12.39%,12.40%
B: 12.45%,12.35%,12.39%,12.47%,12.32%,12.39%
First, the two data sets are subjected to a statistical study.
n
X
A (Repeatability)
6
12.395
B (Reproducibility)
6
12.395
s
0.016
0.037
Coincidentally, both means are identical; however, the standard deviation obtained in
the reproducibility study (B) is about 3.5 times greater than that for the repeatability
study (A).
Let us examine four different confidence levels, namely: 90% (P = 0.1), 95%
(P = 0.05), 98% (P = 0.02) and 99% (P = 0.01). The corresponding tvalues for 6 -1 = 5
degrees of freedom are given in the following table:
% confidence
90%
95 %
98 %
99 %
P
0.1
0.05
0.Q2
0.01
t
2.02
2.57
3.36
4.03
These values allow one to calculate ± U = t · S for the two sets at different probability
(confidence) levels.