

I
.l:
C.
F.J. Millero
is the equilibrium concentration at the time the water left the surface. This requires
the age of the water parcel. The modified ~C; is given by
*
°
~Ct= TC02 - (TC02)eq(S, t, TA ,fC02(tsample- r) - rC/02(02 - 02(s.I»)
- 0[TA- TAO + rN/02([02]- [02]S.I)]
(1.40 )
where fco 2 (ts.mple - r) is the value of the fugacity of CO2 at the time the water parcel
was in contact with the atmosphere. The age is estimated from the ratio of CFC-ll and
CFC-12 in the water (Weiss et al. 1985) and the fugacity is estimated from a fit of the
results shown in Fig. 1.1 (Keeling and Whorf 1994; Neftel et al. 1994).
Recently these methods have been used to examine the penetration of fossil fuel
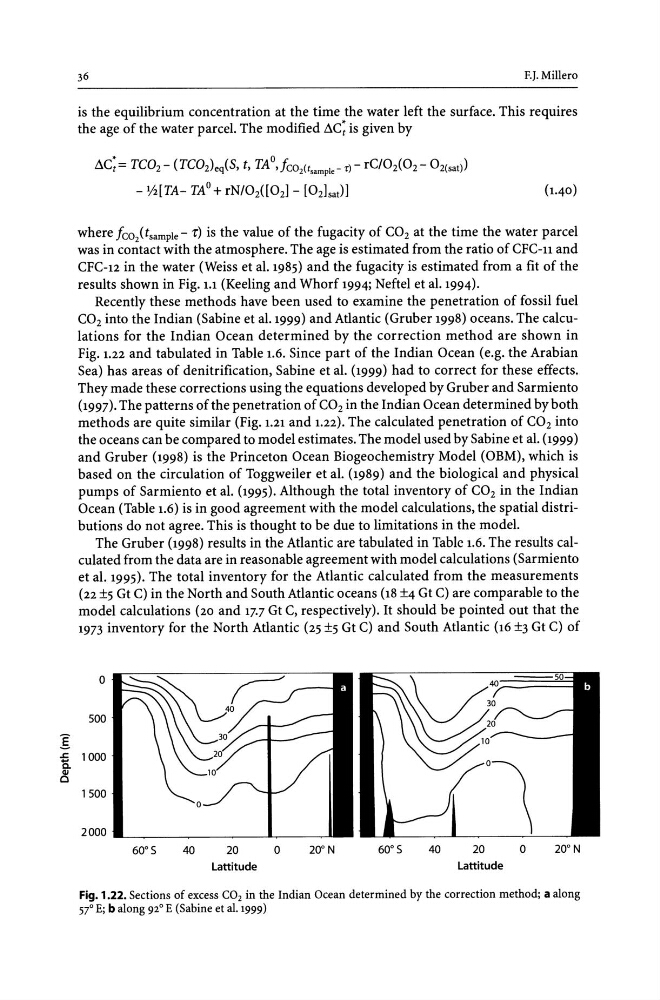
CO2 into the Indian (Sabine et al. 1999) and Atlantic (Gruber 1998) oceans. The calculations for the Indian Ocean determined by the correction method are shown in
Fig. 1.22 and tabulated in Table 1.6. Since part of the Indian Ocean (e.g. the Arabian
Sea) has areas of denitrification, Sabine et al. (1999) had to correct for these effects.
They made these corrections using the equations developed by Gruber and Sarmiento
(1997). The patterns of the penetration of CO2 in the Indian Ocean determined by both
methods are quite similar (Fig. 1.21 and 1.22). The calculated penetration of CO2 into
the oceans can be compared to model estimates. The model used by Sabine et al. (1999)
and Gruber (1998) is the Princeton Ocean Biogeochemistry Model (OBM), which is
based on the circulation of Toggweiler et al. (1989) and the biological and physical
pumps of Sarmiento et al. (1995). Although the total inventory of CO2 in the Indian
Ocean (Table 1.6) is in good agreement with the model calculations, the spatial distributions do not agree. This is thought to be due to limitations in the model.
The Gruber (1998) results in the Atlantic are tabulated in Table 1.6. The results calculated from the data are in reasonable agreement with model calculations (Sarmiento
et al. 1995). The total inventory for the Atlantic calculated from the measurements
(22 ±5 Gt C) in the North and South Atlantic oceans (18 ±4 Gt C) are comparable to the
model calculations (20 and 17.7 Gt C, respectively). It should be pointed out that the
1973 inventory for the North Atlantic (25 ±5 Gt C) and South Atlantic (16 ±3 Gt C) of
0
500
1000
1500
2000
60 0 5
40
20
Lattitude
0
20 0 N
60 0 5
40
20
Lattitude
o
20 0 N
Fig. 1.22. Sections of excess CO2 in the Indian Ocean determined by the correction method; a along
57 0 E; b along 92° E (Sabine et al. 1999)
.l:
C.
F.J. Millero
is the equilibrium concentration at the time the water left the surface. This requires
the age of the water parcel. The modified ~C; is given by
*
°
~Ct= TC02 - (TC02)eq(S, t, TA ,fC02(tsample- r) - rC/02(02 - 02(s.I»)
- 0[TA- TAO + rN/02([02]- [02]S.I)]
(1.40 )
where fco 2 (ts.mple - r) is the value of the fugacity of CO2 at the time the water parcel
was in contact with the atmosphere. The age is estimated from the ratio of CFC-ll and
CFC-12 in the water (Weiss et al. 1985) and the fugacity is estimated from a fit of the
results shown in Fig. 1.1 (Keeling and Whorf 1994; Neftel et al. 1994).
Recently these methods have been used to examine the penetration of fossil fuel
CO2 into the Indian (Sabine et al. 1999) and Atlantic (Gruber 1998) oceans. The calculations for the Indian Ocean determined by the correction method are shown in
Fig. 1.22 and tabulated in Table 1.6. Since part of the Indian Ocean (e.g. the Arabian
Sea) has areas of denitrification, Sabine et al. (1999) had to correct for these effects.
They made these corrections using the equations developed by Gruber and Sarmiento
(1997). The patterns of the penetration of CO2 in the Indian Ocean determined by both
methods are quite similar (Fig. 1.21 and 1.22). The calculated penetration of CO2 into
the oceans can be compared to model estimates. The model used by Sabine et al. (1999)
and Gruber (1998) is the Princeton Ocean Biogeochemistry Model (OBM), which is
based on the circulation of Toggweiler et al. (1989) and the biological and physical
pumps of Sarmiento et al. (1995). Although the total inventory of CO2 in the Indian
Ocean (Table 1.6) is in good agreement with the model calculations, the spatial distributions do not agree. This is thought to be due to limitations in the model.
The Gruber (1998) results in the Atlantic are tabulated in Table 1.6. The results calculated from the data are in reasonable agreement with model calculations (Sarmiento
et al. 1995). The total inventory for the Atlantic calculated from the measurements
(22 ±5 Gt C) in the North and South Atlantic oceans (18 ±4 Gt C) are comparable to the
model calculations (20 and 17.7 Gt C, respectively). It should be pointed out that the
1973 inventory for the North Atlantic (25 ±5 Gt C) and South Atlantic (16 ±3 Gt C) of
0
500
1000
1500
2000
60 0 5
40
20
Lattitude
0
20 0 N
60 0 5
40
20
Lattitude
o
20 0 N
Fig. 1.22. Sections of excess CO2 in the Indian Ocean determined by the correction method; a along
57 0 E; b along 92° E (Sabine et al. 1999)