

§
.J::
.... C.
QI
c
34
F. J. Millero
a = 706.5,b = 7.7,c = -6.68,d = 0.513, and e = 0.7255 with (]'= 5.21lmol kg-I. Bycomparing the GEOSECS fit with the more recent measurements 18 years later during the
WOCE/JGOFS studies, Sabine et al. (1999) have been able to examine the changes in
the TC02 in the deep waters (>200 db). The penetration of CO 2 into the Indian Ocean
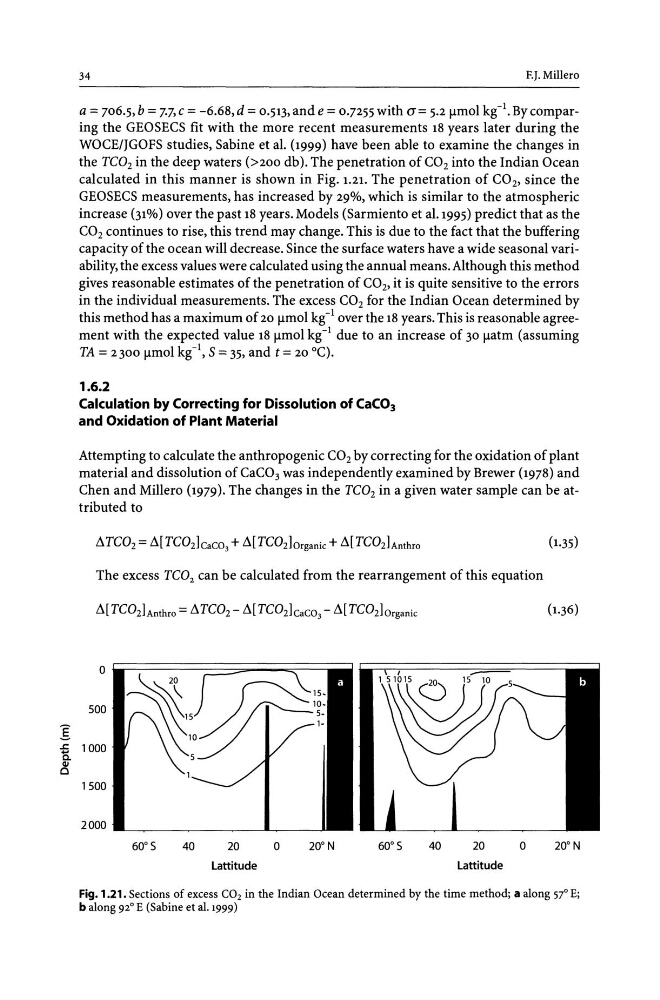
calculated in this manner is shown in Fig. 1.21. The penetration of CO2, since the
GEOSECS measurements, has increased by 29%, which is similar to the atmospheric
increase (31%) over the past 18 years. Models (Sarmiento et al.1995) predict that as the
CO2 continues to rise, this trend may change. This is due to the fact that the buffering
capacity of the ocean will decrease. Since the surface waters have a wide seasonal variability, the excess values were calculated using the annual means. Although this method
gives reasonable estimates of the penetration of CO2, it is quite sensitive to the errors
in the individual measurements. The excess CO2 for the Indian Ocean determined by
this method has a maximum of 20 Ilmol kg-lover the 18 years. This is reasonable agreement with the expected value 181lmol kg- 1 due to an increase of 30 Ilatm (assuming
TA = 2300 Ilmol kg-I, S = 35, and t = 20°C).
1.6.2
Calculation by Correcting for Dissolution of CaC0 3
and Oxidation of Plant Material
Attempting to calculate the anthropogenic CO2 by correcting for the oxidation of plant
material and dissolution of CaC0 3 was independently examined by Brewer (1978) and
Chen and Millero (1979). The changes in the TC02 in a given water sample can be attributed to
The excess TC02 can be calculated from the rearrangement of this equation
0
500
1000
1500
2000
60°5
40
20
Lattitude
0
200N
60°5
40
20
Lattitude
o
200N
Fig. 1.21. Sections of excess CO2 in the Indian Ocean determined by the time method; a along 57° E;
b along 92° E (Sabine et al.1999)
.J::
.... C.
QI
c
34
F. J. Millero
a = 706.5,b = 7.7,c = -6.68,d = 0.513, and e = 0.7255 with (]'= 5.21lmol kg-I. Bycomparing the GEOSECS fit with the more recent measurements 18 years later during the
WOCE/JGOFS studies, Sabine et al. (1999) have been able to examine the changes in
the TC02 in the deep waters (>200 db). The penetration of CO 2 into the Indian Ocean
calculated in this manner is shown in Fig. 1.21. The penetration of CO2, since the
GEOSECS measurements, has increased by 29%, which is similar to the atmospheric
increase (31%) over the past 18 years. Models (Sarmiento et al.1995) predict that as the
CO2 continues to rise, this trend may change. This is due to the fact that the buffering
capacity of the ocean will decrease. Since the surface waters have a wide seasonal variability, the excess values were calculated using the annual means. Although this method
gives reasonable estimates of the penetration of CO2, it is quite sensitive to the errors
in the individual measurements. The excess CO2 for the Indian Ocean determined by
this method has a maximum of 20 Ilmol kg-lover the 18 years. This is reasonable agreement with the expected value 181lmol kg- 1 due to an increase of 30 Ilatm (assuming
TA = 2300 Ilmol kg-I, S = 35, and t = 20°C).
1.6.2
Calculation by Correcting for Dissolution of CaC0 3
and Oxidation of Plant Material
Attempting to calculate the anthropogenic CO2 by correcting for the oxidation of plant
material and dissolution of CaC0 3 was independently examined by Brewer (1978) and
Chen and Millero (1979). The changes in the TC02 in a given water sample can be attributed to
The excess TC02 can be calculated from the rearrangement of this equation
0
500
1000
1500
2000
60°5
40
20
Lattitude
0
200N
60°5
40
20
Lattitude
o
200N
Fig. 1.21. Sections of excess CO2 in the Indian Ocean determined by the time method; a along 57° E;
b along 92° E (Sabine et al.1999)