

CHAPTER 22 . Chemometric Applications to Seawater Analysis
411
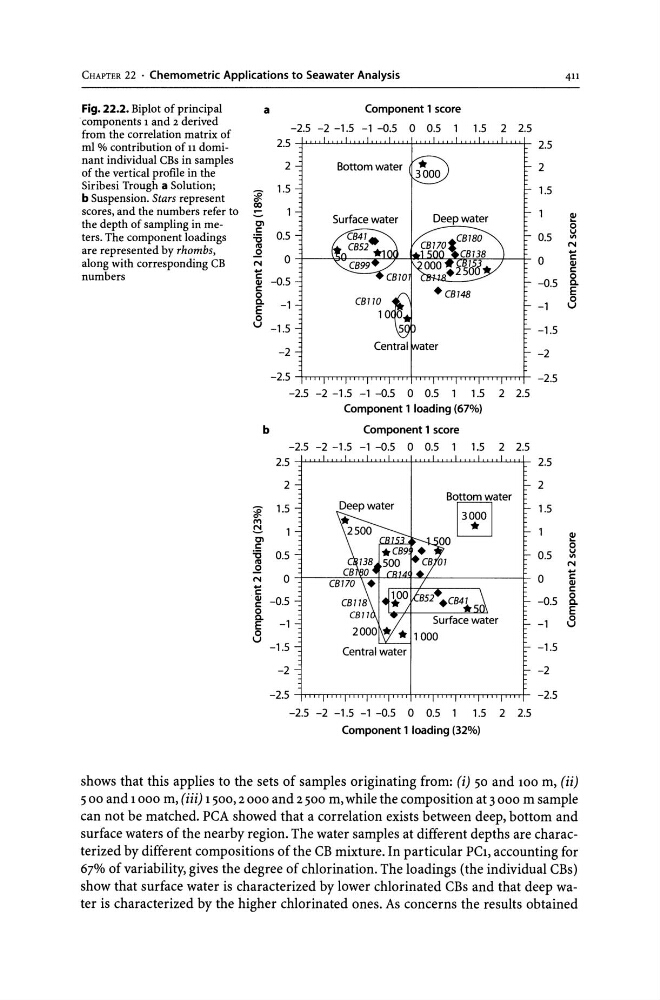
Fig. 22.2. Biplot of principal
a
Component 1 score
'components 1 and 2 derived
-2.S -2 -1.5 -1 -0.5 0 O.S
1.S 2 2.5
from the correlation matrix of
rnl % contribution of 11 domi2.S
2.S
nant individual CBs in samples
2
Bottom water
*
2
of the vertical profile in the
3000
Siribesi Trough a Solution;
~
1.5
1.5
b Suspension. Stars represent
co
scores, and the numbers refer to
=
l!!
the depth of sampling in mee>
e
c
ters. The component loadings
'6 O.S
O.S
III
are represented by rhombs,
'"
N
£!
...
0
0
c
along with corresponding CB
N
CII
...
c
numbers
c -0.5
0
CII
-0.5 Co
c
E
0
8
Co
-1
-1
E
0
u -1.5
-l.S
-2
-2
-2.5
-2.5
-2.S -2 -1.5 -1 -O.S 0 0.5
1.5 2 2.5
Component 1 loading (67%)
b
Component 1 score
-2.5 -2 -1.5 -1 -O.S 0 0.5 1 1.5 2 2.5
2.5
2.S
2
2
Bottom water
~ 1.S
13~0 I
1.S
rtI
~
l!!
e>
00
c
0
'6 0.5
0.5
v
III
'"
N
£!
...
N
0
0
c
CII
...
C
c
8.
CII -O.S
-0.5
c
0
E
Co
-1
-1
8
E
8 -1.5
Central water
-1.5
-2
-2
-2.5
-2.5
-2.5 -2 -1.5 -1 -O.S 0 O.S
1.5 2 2.S
Component 1 loading (32%)
shows that this applies to the sets of samples originating from: (i) 50 and 100 m, (ii)
500 and 1 000 m, (iii) 1500,2000 and 2 500 m, while the composition at 3000 m sample
can not be matched. PCA showed that a correlation exists between deep, bottom and
surface waters of the nearby region. The water samples at different depths are characterized by different compositions of the CB mixture. In particular PC1, accounting for
67% of variability, gives the degree of chlorination. The loadings (the individual CBs)
show that surface water is characterized by lower chlorinated CBs and that deep water is characterized by the higher chlorinated ones. As concerns the results obtained
411
Fig. 22.2. Biplot of principal
a
Component 1 score
'components 1 and 2 derived
-2.S -2 -1.5 -1 -0.5 0 O.S
1.S 2 2.5
from the correlation matrix of
rnl % contribution of 11 domi2.S
2.S
nant individual CBs in samples
2
Bottom water
*
2
of the vertical profile in the
3000
Siribesi Trough a Solution;
~
1.5
1.5
b Suspension. Stars represent
co
scores, and the numbers refer to
=
l!!
the depth of sampling in mee>
e
c
ters. The component loadings
'6 O.S
O.S
III
are represented by rhombs,
'"
N
£!
...
0
0
c
along with corresponding CB
N
CII
...
c
numbers
c -0.5
0
CII
-0.5 Co
c
E
0
8
Co
-1
-1
E
0
u -1.5
-l.S
-2
-2
-2.5
-2.5
-2.S -2 -1.5 -1 -O.S 0 0.5
1.5 2 2.5
Component 1 loading (67%)
b
Component 1 score
-2.5 -2 -1.5 -1 -O.S 0 0.5 1 1.5 2 2.5
2.5
2.S
2
2
Bottom water
~ 1.S
13~0 I
1.S
rtI
~
l!!
e>
00
c
0
'6 0.5
0.5
v
III
'"
N
£!
...
N
0
0
c
CII
...
C
c
8.
CII -O.S
-0.5
c
0
E
Co
-1
-1
8
E
8 -1.5
Central water
-1.5
-2
-2
-2.5
-2.5
-2.5 -2 -1.5 -1 -O.S 0 O.S
1.5 2 2.S
Component 1 loading (32%)
shows that this applies to the sets of samples originating from: (i) 50 and 100 m, (ii)
500 and 1 000 m, (iii) 1500,2000 and 2 500 m, while the composition at 3000 m sample
can not be matched. PCA showed that a correlation exists between deep, bottom and
surface waters of the nearby region. The water samples at different depths are characterized by different compositions of the CB mixture. In particular PC1, accounting for
67% of variability, gives the degree of chlorination. The loadings (the individual CBs)
show that surface water is characterized by lower chlorinated CBs and that deep water is characterized by the higher chlorinated ones. As concerns the results obtained