

410
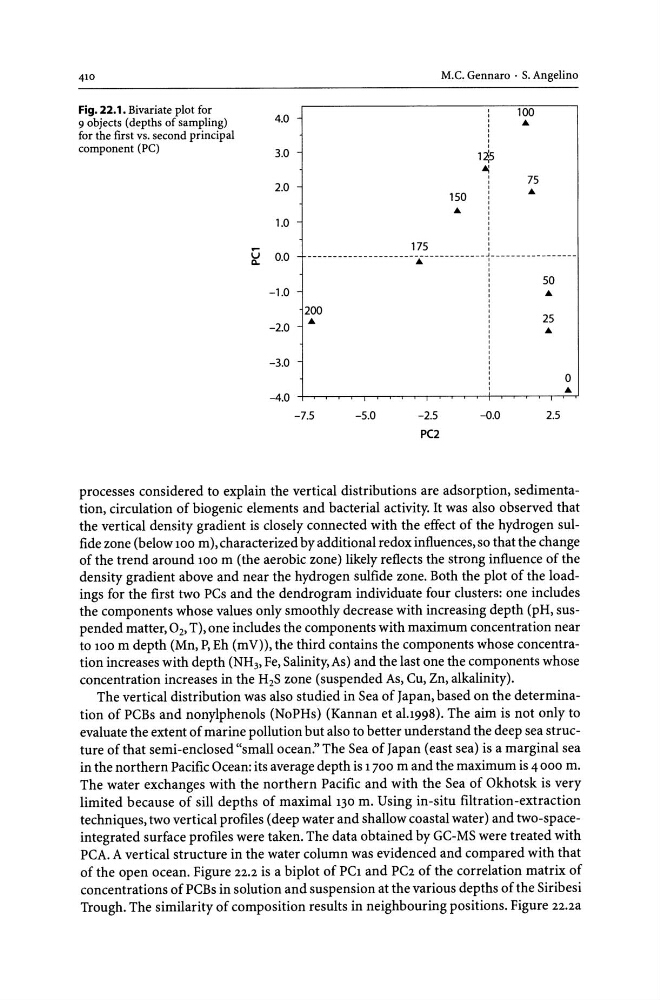
Fig. 22.1. Bivariate plot for
9 objects (depths of sampling)
for the first vs. second principal
component (PC)
4.0
3.0
2.0
1.0
~ 0.0
-1.0
-2.0
-3.0
-4.0
175
M.e. Gennaro· S. Angelino
, , , , , ,
, ,
1~
Ai , ,
,
150
:
, , , , , , , , ,
100
75
___ ____ ____________________________ .J _______________ _
A
50
A
200
A
25
A
0
A
-7.5
-5.0
-2.5
-0.0
2.5
pe2
processes considered to explain the vertical distributions are adsorption, sedimentation, circulation of biogenic elements and bacterial activity. It was also observed that
the vertical density gradient is closely connected with the effect of the hydrogen sulfide zone (below 100 m), characterized by additional redox influences, so that the change
of the trend around 100 m (the aerobic zone) likely reflects the strong influence of the
density gradient above and near the hydrogen sulfide zone. Both the plot of the loadings for the first two PCs and the dendrogram individuate four clusters: one includes
the components whose values only smoothly decrease with increasing depth (pH, suspended matter, O2, T), one includes the components with maximum concentration near
to 100 m depth (Mn, P, Eh (mV», the third contains the components whose concentration increases with depth (NH3, Fe, Salinity, As) and the last one the components whose
concentration increases in the H2S zone (suspended As, Cu, Zn, alkalinity).
The vertical distribution was also studied in Sea of Japan, based on the determination of PCBs and nonylphenols (NoPHs) (Kannan et aL1998). The aim is not only to
evaluate the extent of marine pollution but also to better understand the deep sea structure of that semi-enclosed "small ocean." The Sea of Japan (east sea) is a marginal sea
in the northern Pacific Ocean: its average depth is 1700 m and the maximum is 4 000 m.
The water exchanges with the northern Pacific and with the Sea of Okhotsk is very
limited because of sill depths of maximal 130 m. Using in-situ filtration-extraction
techniques, two vertical profiles (deep water and shallow coastal water) and two-spaceintegrated surface profiles were taken. The data obtained by GC-MS were treated with
PCA. A vertical structure in the water column was evidenced and compared with that
of the open ocean. Figure 22.2 is a biplot of PC1 and PC2 of the correlation matrix of
concentrations of PCBs in solution and suspension at the various depths of the Siribesi
Trough. The similarity of composition results in neighbouring positions. Figure 22.2a
Fig. 22.1. Bivariate plot for
9 objects (depths of sampling)
for the first vs. second principal
component (PC)
4.0
3.0
2.0
1.0
~ 0.0
-1.0
-2.0
-3.0
-4.0
175
M.e. Gennaro· S. Angelino
, , , , , ,
, ,
1~
Ai , ,
,
150
:
, , , , , , , , ,
100
75
___ ____ ____________________________ .J _______________ _
A
50
A
200
A
25
A
0
A
-7.5
-5.0
-2.5
-0.0
2.5
pe2
processes considered to explain the vertical distributions are adsorption, sedimentation, circulation of biogenic elements and bacterial activity. It was also observed that
the vertical density gradient is closely connected with the effect of the hydrogen sulfide zone (below 100 m), characterized by additional redox influences, so that the change
of the trend around 100 m (the aerobic zone) likely reflects the strong influence of the
density gradient above and near the hydrogen sulfide zone. Both the plot of the loadings for the first two PCs and the dendrogram individuate four clusters: one includes
the components whose values only smoothly decrease with increasing depth (pH, suspended matter, O2, T), one includes the components with maximum concentration near
to 100 m depth (Mn, P, Eh (mV», the third contains the components whose concentration increases with depth (NH3, Fe, Salinity, As) and the last one the components whose
concentration increases in the H2S zone (suspended As, Cu, Zn, alkalinity).
The vertical distribution was also studied in Sea of Japan, based on the determination of PCBs and nonylphenols (NoPHs) (Kannan et aL1998). The aim is not only to
evaluate the extent of marine pollution but also to better understand the deep sea structure of that semi-enclosed "small ocean." The Sea of Japan (east sea) is a marginal sea
in the northern Pacific Ocean: its average depth is 1700 m and the maximum is 4 000 m.
The water exchanges with the northern Pacific and with the Sea of Okhotsk is very
limited because of sill depths of maximal 130 m. Using in-situ filtration-extraction
techniques, two vertical profiles (deep water and shallow coastal water) and two-spaceintegrated surface profiles were taken. The data obtained by GC-MS were treated with
PCA. A vertical structure in the water column was evidenced and compared with that
of the open ocean. Figure 22.2 is a biplot of PC1 and PC2 of the correlation matrix of
concentrations of PCBs in solution and suspension at the various depths of the Siribesi
Trough. The similarity of composition results in neighbouring positions. Figure 22.2a