

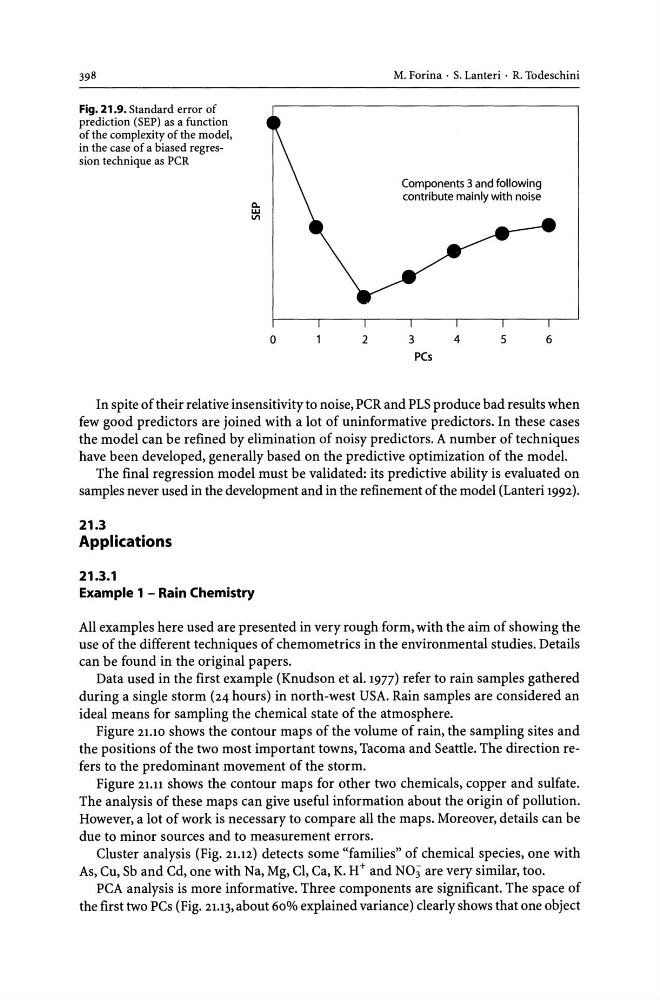
Fig. 21.9. Standard error of
prediction (SEP) as a function
of the complexity of the model,
in the case of a biased regression technique as peR
D..
w
1/1
o
2
M. Forina . S. Lanteri . R. Todeschini
Components 3 and following
contribute mainly with noise
3
4
5
PCs
6
In spite of their relative insensitivity to noise, PCR and PLS produce bad results when
few good predictors are joined with a lot of uninformative predictors. In these cases
the model can be refined by elimination of noisy predictors. A number of techniques
have been developed, generally based on the predictive optimization of the model.
The final regression model must be validated: its predictive ability is evaluated on
samples never used in the development and in the refinement of the model (Lanteri 1992).
21.3
Applications
21.3.1
Example 1 - Rain Chemistry
All examples here used are presented in very rough form, with the aim of showing the
use of the different techniques of chemometrics in the environmental studies. Details
can be found in the original papers.
Data used in the first example (Knudson et al.1977) refer to rain samples gathered
during a single storm (24 hours) in north-west USA. Rain samples are considered an
ideal means for sampling the chemical state of the atmosphere.
Figure 21.10 shows the contour maps of the volume of rain, the sampling sites and
the positions of the two most important towns, Tacoma and Seattle. The direction refers to the predominant movement of the storm.
Figure 21.11 shows the contour maps for other two chemicals, copper and sulfate.
The analysis of these maps can give useful information about the origin of pollution.
However, a lot of work is necessary to compare all the maps. Moreover, details can be
due to minor sources and to measurement errors.
Cluster analysis (Fig. 21.12) detects some "families" of chemical species, one with
As, Cu, Sb and Cd, one with Na, Mg, CI, Ca, K. H+ and NO; are very similar, too.
PCA analysis is more informative. Three components are significant. The space of
the first two PCs (Fig. 21.13, about 60% explained variance) clearly shows that one object
prediction (SEP) as a function
of the complexity of the model,
in the case of a biased regression technique as peR
D..
w
1/1
o
2
M. Forina . S. Lanteri . R. Todeschini
Components 3 and following
contribute mainly with noise
3
4
5
PCs
6
In spite of their relative insensitivity to noise, PCR and PLS produce bad results when
few good predictors are joined with a lot of uninformative predictors. In these cases
the model can be refined by elimination of noisy predictors. A number of techniques
have been developed, generally based on the predictive optimization of the model.
The final regression model must be validated: its predictive ability is evaluated on
samples never used in the development and in the refinement of the model (Lanteri 1992).
21.3
Applications
21.3.1
Example 1 - Rain Chemistry
All examples here used are presented in very rough form, with the aim of showing the
use of the different techniques of chemometrics in the environmental studies. Details
can be found in the original papers.
Data used in the first example (Knudson et al.1977) refer to rain samples gathered
during a single storm (24 hours) in north-west USA. Rain samples are considered an
ideal means for sampling the chemical state of the atmosphere.
Figure 21.10 shows the contour maps of the volume of rain, the sampling sites and
the positions of the two most important towns, Tacoma and Seattle. The direction refers to the predominant movement of the storm.
Figure 21.11 shows the contour maps for other two chemicals, copper and sulfate.
The analysis of these maps can give useful information about the origin of pollution.
However, a lot of work is necessary to compare all the maps. Moreover, details can be
due to minor sources and to measurement errors.
Cluster analysis (Fig. 21.12) detects some "families" of chemical species, one with
As, Cu, Sb and Cd, one with Na, Mg, CI, Ca, K. H+ and NO; are very similar, too.
PCA analysis is more informative. Three components are significant. The space of
the first two PCs (Fig. 21.13, about 60% explained variance) clearly shows that one object