

CHAPTER 19 • PIXE Analysis for Trace Elements in Marine Environments
that corresponds to a confidence level of 99.86% for normally distributed measurements.
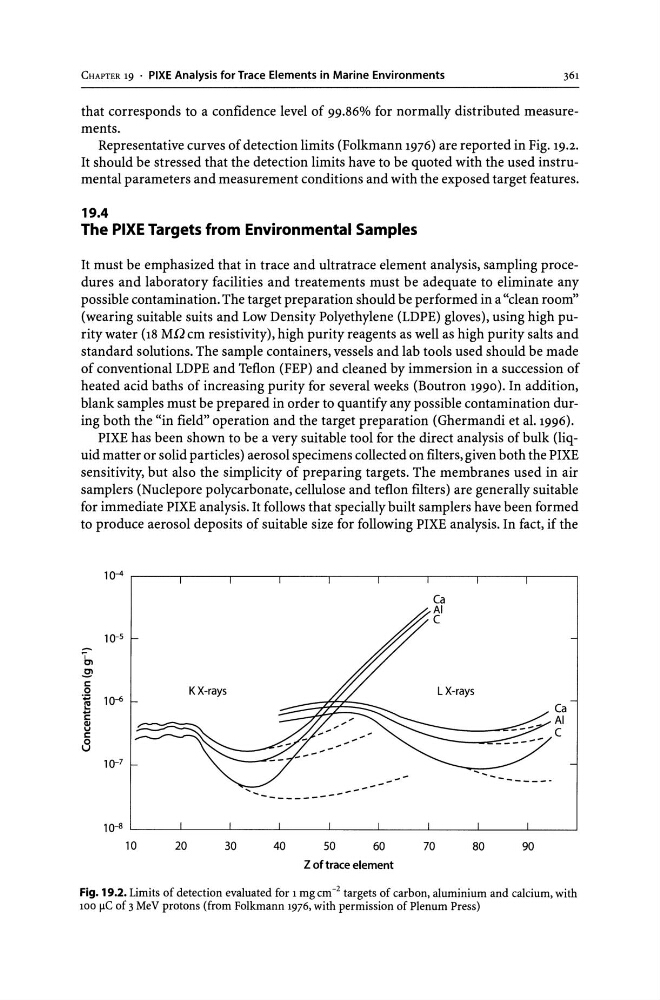
Representative curves of detection limits (Folkmann 1976) are reported in Fig. 19.2.
It should be stressed that the detection limits have to be quoted with the used instrumental parameters and measurement conditions and with the exposed target features.
19.4
The PIXE Targets from Environmental Samples
It must be emphasized that in trace and ultratrace element analysis, sampling procedures and laboratory facilities and treatements must be adequate to eliminate any
possible contamination. The target preparation should be performed in a "clean room"
(wearing suitable suits and Low Density Polyethylene (LDPE) gloves), using high purity water (18 Mil cm resistivity), high purity reagents as well as high purity salts and
standard solutions. The sample containers, vessels and lab tools used should be made
of conventional LDPE and Teflon (FEP) and cleaned by immersion in a succession of
heated acid baths of increasing purity for several weeks (Boutron 1990). In addition,
blank samples must be prepared in order to quantify any possible contamination during both the "in field" operation and the target preparation (Ghermandi et al.1996).
PIXE has been shown to be a very suitable tool for the direct analysis of bulk (liquid matter or solid particles) aerosol specimens collected on filters, given both the PIXE
sensitivity, but also the simplicity of preparing targets. The membranes used in air
samplers (Nuclepore polycarbonate, cellulose and teflon filters) are generally suitable
for immediate PIXE analysis. It follows that specially built samplers have been formed
to produce aerosol deposits of suitable size for following PIXE analysis. In fact, if the
1~ ,----,-----,-----,-----,----,-----,-----,----,-----,
10-5
10-7
' " ------Ca
AI
C
1~8
L -_ _ _ _ ~ _ _ _ _ ~ _ _ _ _ ~ _ _ _ _ _ L _ _ _ _ _ L _ _ _ _ ~ _ _ _ _ ~ _ _ _ _ _ _ L-__ ~
10
20
30
40
50
60
70
80
90
Z oftrace element
Fig. 19.2. limits of detection evaluated for 1 mg cm -2 targets of carbon, aluminium and calcium, with
100 f!C of 3 MeV protons (from Folkmann 1976, with permission of Plenum Press)
that corresponds to a confidence level of 99.86% for normally distributed measurements.
Representative curves of detection limits (Folkmann 1976) are reported in Fig. 19.2.
It should be stressed that the detection limits have to be quoted with the used instrumental parameters and measurement conditions and with the exposed target features.
19.4
The PIXE Targets from Environmental Samples
It must be emphasized that in trace and ultratrace element analysis, sampling procedures and laboratory facilities and treatements must be adequate to eliminate any
possible contamination. The target preparation should be performed in a "clean room"
(wearing suitable suits and Low Density Polyethylene (LDPE) gloves), using high purity water (18 Mil cm resistivity), high purity reagents as well as high purity salts and
standard solutions. The sample containers, vessels and lab tools used should be made
of conventional LDPE and Teflon (FEP) and cleaned by immersion in a succession of
heated acid baths of increasing purity for several weeks (Boutron 1990). In addition,
blank samples must be prepared in order to quantify any possible contamination during both the "in field" operation and the target preparation (Ghermandi et al.1996).
PIXE has been shown to be a very suitable tool for the direct analysis of bulk (liquid matter or solid particles) aerosol specimens collected on filters, given both the PIXE
sensitivity, but also the simplicity of preparing targets. The membranes used in air
samplers (Nuclepore polycarbonate, cellulose and teflon filters) are generally suitable
for immediate PIXE analysis. It follows that specially built samplers have been formed
to produce aerosol deposits of suitable size for following PIXE analysis. In fact, if the
1~ ,----,-----,-----,-----,----,-----,-----,----,-----,
10-5
10-7
' " ------Ca
AI
C
1~8
L -_ _ _ _ ~ _ _ _ _ ~ _ _ _ _ ~ _ _ _ _ _ L _ _ _ _ _ L _ _ _ _ ~ _ _ _ _ ~ _ _ _ _ _ _ L-__ ~
10
20
30
40
50
60
70
80
90
Z oftrace element
Fig. 19.2. limits of detection evaluated for 1 mg cm -2 targets of carbon, aluminium and calcium, with
100 f!C of 3 MeV protons (from Folkmann 1976, with permission of Plenum Press)