

CHAPTER 19 . PIXE Analysis for Trace Elements in Marine Environments
359
ized by accelerated particles, and detected by a suitable device (i.e. a Si (Li) X photon
detector). The filling of produced vacancies induces the emission of photons, whose
energies identify each particular atom (mainly K and LX-ray, M lines in a few cases,
of different intensities given their relative emission rates). K and L or Land M lines
from the same element may be simultaneously present in a PIXE spectrum.
The number of emitted X-ray photons for a given atom transition depends on its
production cross section for protons at the energy of the used beam, on the relative
intensity of the transition, and on the proton flux.
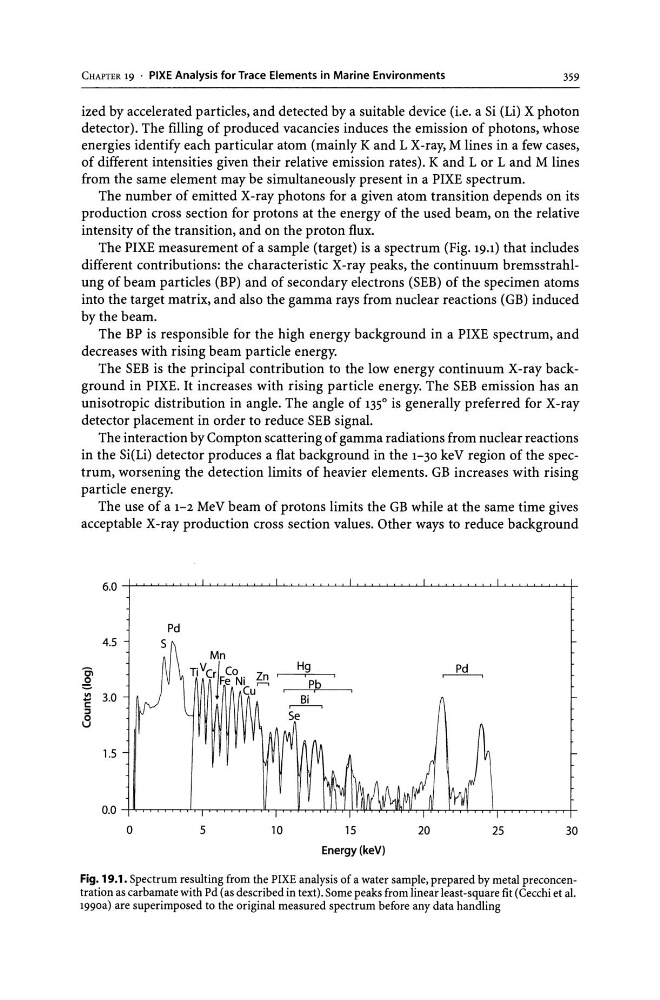
The PIXE measurement of a sample (target) is a spectrum (Fig. 19.1) that includes
different contributions: the characteristic X-ray peaks, the continuum bremsstrahlung of beam particles (BP) and of secondary electrons (SEB) of the specimen atoms
into the target matrix, and also the gamma rays from nuclear reactions (GB) induced
by the beam.
The BP is responsible for the high energy background in a PIXE spectrum, and
decreases with rising beam particle energy.
The SEB is the principal contribution to the low energy continuum X-ray background in PIXE. It increases with rising particle energy. The SEB emission has an
unisotropic distribution in angle. The angle of 135 0 is generally preferred for X-ray
detector placement in order to reduce SEB signal.
The interaction by Compton scattering of gamma radiations from nuclear reactions
in the Si(Li) detector produces a flat background in the 1-30 keV region of the spectrum, worsening the detection limits of heavier elements. GB increases with rising
particle energy.
The use of a 1-2 MeV beam of protons limits the GB while at the same time gives
acceptable X-ray production cross section values. Other ways to reduce background
4.5
Mn
C.
TiVcrj Co. Zn
g
Fe NI ......,
OIl
3.0
Cu
.... C
::::I
(3
1.5
o
5
H~
P,b
10
15
Energy (keV)
~
20
25
30
Fig. 19.1. Spectrum resulting from the PIXE analysis of a water sample, prepared by metal preconcentration as carbamate with Pd (as described in text). Some peaks from linear least-square fit (Cecchi et al.
1990a) are superimposed to the original measured spectrum before any data handling
359
ized by accelerated particles, and detected by a suitable device (i.e. a Si (Li) X photon
detector). The filling of produced vacancies induces the emission of photons, whose
energies identify each particular atom (mainly K and LX-ray, M lines in a few cases,
of different intensities given their relative emission rates). K and L or Land M lines
from the same element may be simultaneously present in a PIXE spectrum.
The number of emitted X-ray photons for a given atom transition depends on its
production cross section for protons at the energy of the used beam, on the relative
intensity of the transition, and on the proton flux.
The PIXE measurement of a sample (target) is a spectrum (Fig. 19.1) that includes
different contributions: the characteristic X-ray peaks, the continuum bremsstrahlung of beam particles (BP) and of secondary electrons (SEB) of the specimen atoms
into the target matrix, and also the gamma rays from nuclear reactions (GB) induced
by the beam.
The BP is responsible for the high energy background in a PIXE spectrum, and
decreases with rising beam particle energy.
The SEB is the principal contribution to the low energy continuum X-ray background in PIXE. It increases with rising particle energy. The SEB emission has an
unisotropic distribution in angle. The angle of 135 0 is generally preferred for X-ray
detector placement in order to reduce SEB signal.
The interaction by Compton scattering of gamma radiations from nuclear reactions
in the Si(Li) detector produces a flat background in the 1-30 keV region of the spectrum, worsening the detection limits of heavier elements. GB increases with rising
particle energy.
The use of a 1-2 MeV beam of protons limits the GB while at the same time gives
acceptable X-ray production cross section values. Other ways to reduce background
4.5
Mn
C.
TiVcrj Co. Zn
g
Fe NI ......,
OIl
3.0
Cu
.... C
::::I
(3
1.5
o
5
H~
P,b
10
15
Energy (keV)
~
20
25
30
Fig. 19.1. Spectrum resulting from the PIXE analysis of a water sample, prepared by metal preconcentration as carbamate with Pd (as described in text). Some peaks from linear least-square fit (Cecchi et al.
1990a) are superimposed to the original measured spectrum before any data handling