

250
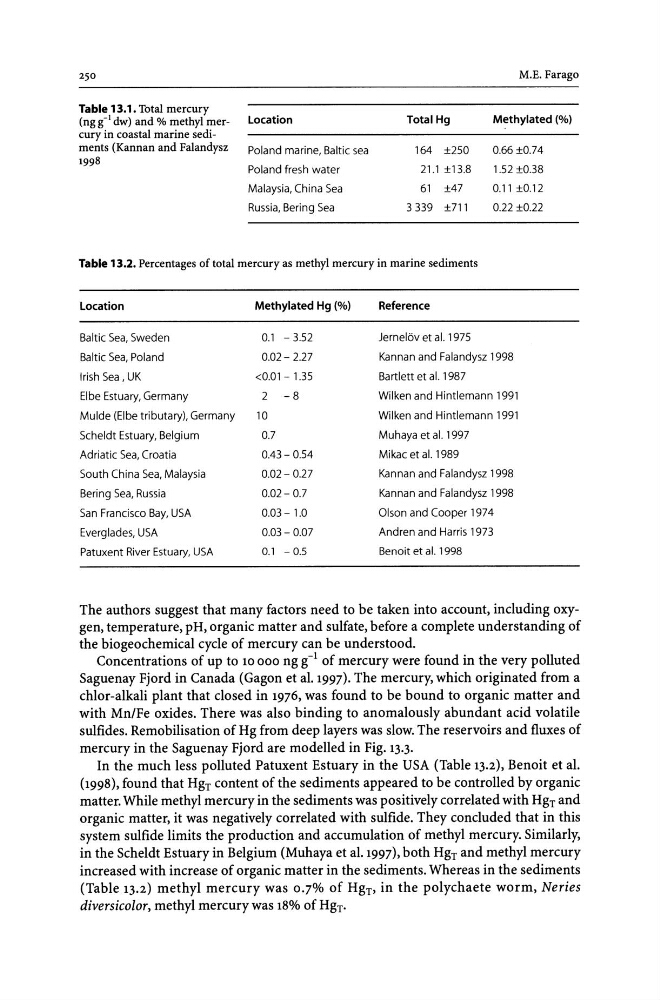
Table 13.1. Total mercury
(ng g-l dw) and % methyl mercury in coastal marine sediments (Kannan and Falandysz
1998
Location
Poland marine, Baltic sea
Poland fresh water
Malaysia, China Sea
Russia, Bering Sea
Total Hg
164 ±250
21.1 ±13.8
61 ±47
3339 ±711
M.E. Farago
Methylated (%)
0.66 ±0.74
1.52 ±0.38
0.11 ±0.12
0.22 ±0.22
Table 13.2. Percentages of total mercury as methyl mercury in marine sediments
Location
Methylated Hg (%)
Reference
Baltic Sea, Sweden
0.1 - 3.52
Jernel6v et al. 1975
Baltic Sea, Poland
0.02 - 2.27
Kannan and Falandysz 1998
Irish Sea, UK
<0.01 - 1.35
Bartlett et al. 1987
Elbe Estuary, Germany
2
-8
Wilken and Hintlemann 1991
Mulde (Elbe tributary), Germany
10
Wilken and Hintlemann 1991
Scheidt Estuary, Belgium
0.7
Muhaya et al. 1997
Adriatic Sea, Croatia
0.43 - 0.54
Mikac et al. 1989
South China Sea, Malaysia
0.02- 0.27
Kannan and Falandysz 1998
Bering Sea, Russia
0.02- 0.7
Kannan and Falandysz 1998
San Francisco Bay, USA
0.03-1.0
Olson and Cooper 1974
Everglades, USA
0.03 - 0.07
Andren and Harris 1973
Patuxent River Estuary. USA
0.1 - 0.5
Benoit et al. 1998
The authors suggest that many factors need to be taken into account, including oxygen, temperature, pH, organic matter and sulfate, before a complete understanding of
the biogeochemical cycle of mercury can be understood.
Concentrations of up to 10000 ng g-l of mercury were found in the very polluted
Saguenay Fjord in Canada (Gagon et al. 1997). The mercury, which originated from a
chlor-alkali plant that closed in 1976, was found to be bound to organic matter and
with Mn/Fe oxides. There was also binding to anomalously abundant acid volatile
sulfides. Remobilisation of Hg from deep layers was slow. The reservoirs and fluxes of
mercury in the Saguenay Fjord are modelled in Fig. 13.3.
In the much less polluted Patuxent Estuary in the USA (Table 13.2), Benoit et al.
(1998), found that Hgr content of the sediments appeared to be controlled by organic
matter. While methyl mercury in the sediments was positively correlated with Hgr and
organic matter, it was negatively correlated with sulfide. They concluded that in this
system sulfide limits the production and accumulation of methyl mercury. Similarly,
in the ScheIdt Estuary in Belgium (Muhaya et al. 1997), both Hgr and methyl mercury
increased with increase of organic matter in the sediments. Whereas in the sediments
(Table 13.2) methyl mercury was o.iYo of Hgr , in the polychaete worm, Neries
diversicolor, methyl mercury was 18% of Hgr.
Table 13.1. Total mercury
(ng g-l dw) and % methyl mercury in coastal marine sediments (Kannan and Falandysz
1998
Location
Poland marine, Baltic sea
Poland fresh water
Malaysia, China Sea
Russia, Bering Sea
Total Hg
164 ±250
21.1 ±13.8
61 ±47
3339 ±711
M.E. Farago
Methylated (%)
0.66 ±0.74
1.52 ±0.38
0.11 ±0.12
0.22 ±0.22
Table 13.2. Percentages of total mercury as methyl mercury in marine sediments
Location
Methylated Hg (%)
Reference
Baltic Sea, Sweden
0.1 - 3.52
Jernel6v et al. 1975
Baltic Sea, Poland
0.02 - 2.27
Kannan and Falandysz 1998
Irish Sea, UK
<0.01 - 1.35
Bartlett et al. 1987
Elbe Estuary, Germany
2
-8
Wilken and Hintlemann 1991
Mulde (Elbe tributary), Germany
10
Wilken and Hintlemann 1991
Scheidt Estuary, Belgium
0.7
Muhaya et al. 1997
Adriatic Sea, Croatia
0.43 - 0.54
Mikac et al. 1989
South China Sea, Malaysia
0.02- 0.27
Kannan and Falandysz 1998
Bering Sea, Russia
0.02- 0.7
Kannan and Falandysz 1998
San Francisco Bay, USA
0.03-1.0
Olson and Cooper 1974
Everglades, USA
0.03 - 0.07
Andren and Harris 1973
Patuxent River Estuary. USA
0.1 - 0.5
Benoit et al. 1998
The authors suggest that many factors need to be taken into account, including oxygen, temperature, pH, organic matter and sulfate, before a complete understanding of
the biogeochemical cycle of mercury can be understood.
Concentrations of up to 10000 ng g-l of mercury were found in the very polluted
Saguenay Fjord in Canada (Gagon et al. 1997). The mercury, which originated from a
chlor-alkali plant that closed in 1976, was found to be bound to organic matter and
with Mn/Fe oxides. There was also binding to anomalously abundant acid volatile
sulfides. Remobilisation of Hg from deep layers was slow. The reservoirs and fluxes of
mercury in the Saguenay Fjord are modelled in Fig. 13.3.
In the much less polluted Patuxent Estuary in the USA (Table 13.2), Benoit et al.
(1998), found that Hgr content of the sediments appeared to be controlled by organic
matter. While methyl mercury in the sediments was positively correlated with Hgr and
organic matter, it was negatively correlated with sulfide. They concluded that in this
system sulfide limits the production and accumulation of methyl mercury. Similarly,
in the ScheIdt Estuary in Belgium (Muhaya et al. 1997), both Hgr and methyl mercury
increased with increase of organic matter in the sediments. Whereas in the sediments
(Table 13.2) methyl mercury was o.iYo of Hgr , in the polychaete worm, Neries
diversicolor, methyl mercury was 18% of Hgr.