

CHAPTER 11 • Hydrolysis Processes of Organotin(lV) Compounds in Sea Water
225
formation at pH > 10 (completely replacing the simple hydrolytic species 1: 2), does
not influence the formation of the main species at the pH values of sea water.
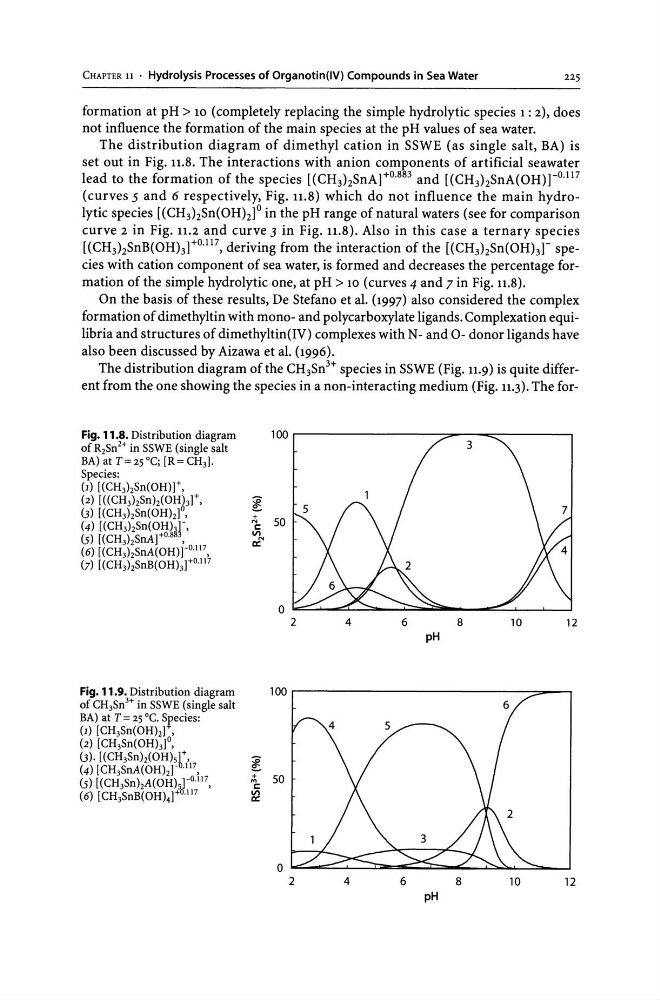
The distribution diagram of dimethyl cation in SSWE (as single salt, BA) is
set out in Fig. 11.8. The interactions with anion components of artificial seawater
lead to the formation of the species [(CH3hSnAl+o.883 and [(CH 3 hSnA(OH)ro. 117
(curves 5 and 6 respectively, Fig. 11.8) which do not influence the main hydrolytic species [(CH3hSn(OHhlo in the pH range of natural waters (see for comparison
curve 2 in Fig. 11.2 and curve 3 in Fig. 11.8). Also in this case a ternary species
[(CH 3 hSnB(OHhto. l17 , deriving from the interaction of the [(CH 3 hSn(OHhr species with cation component of sea water, is formed and decreases the percentage formation of the simple hydrolytic one, at pH > 10 (curves 4 and 7 in Fig. 11.8).
On the basis of these results, De Stefano et al. (1997) also considered the complex
formation of dimethyltin with mono- and polycarboxylate ligands. Complexation equilibria and structures of dimethyltin(IV) complexes with N - and 0- donor ligands have
also been discussed by Aizawa et al. (1996).
The distribution diagram of the CH 3 Sn 3 + species in SSWE (Fig. 11.9) is quite different from the one showing the species in a non-interacting medium (Fig. 11.3). The forFig. 11.8. Distribution diagram
of R2Sn2+ in SSWE (single salt
BA) at T=25°C; [R=CH3].
Species:
(1) [(CH3hSn(OH)]+,
(2) [«CH3hSnlz(OHJ3]+'
(3) [(CH3hSn(OHh] ,
(4) [(CH3hSn(OHh1-,
(s) [(CH3hSnAtO.88~,
(6) [(CH 3 hSnA(OH)ro. 1l7 ,
(7) [(CH3hSnB(OHhto.1l7
Fig. 11.9. Distribution diagram
of CH3Sn H in SSWE (single salt
BA) at T = 25°C. Srecies:
(1) [CH3Sn(OHh] ,
(2) [CH3Sn(OHh]o,
(j). [(CH3Snh(OHlsl+,
(4) [CH3SnA(OHhr t . 1l7 ,
(s) [(CH 3 SnlzA(OHlsro. ll7 ,
(6) [CH3SnB(OH)4]+~·1l7
100r-----------------~--~~------_.
~
1: 50
III
rr.'"
4
6
8
10
12
pH
100.-----------------------------~--~
6
4
6
8
10
12
pH
225
formation at pH > 10 (completely replacing the simple hydrolytic species 1: 2), does
not influence the formation of the main species at the pH values of sea water.
The distribution diagram of dimethyl cation in SSWE (as single salt, BA) is
set out in Fig. 11.8. The interactions with anion components of artificial seawater
lead to the formation of the species [(CH3hSnAl+o.883 and [(CH 3 hSnA(OH)ro. 117
(curves 5 and 6 respectively, Fig. 11.8) which do not influence the main hydrolytic species [(CH3hSn(OHhlo in the pH range of natural waters (see for comparison
curve 2 in Fig. 11.2 and curve 3 in Fig. 11.8). Also in this case a ternary species
[(CH 3 hSnB(OHhto. l17 , deriving from the interaction of the [(CH 3 hSn(OHhr species with cation component of sea water, is formed and decreases the percentage formation of the simple hydrolytic one, at pH > 10 (curves 4 and 7 in Fig. 11.8).
On the basis of these results, De Stefano et al. (1997) also considered the complex
formation of dimethyltin with mono- and polycarboxylate ligands. Complexation equilibria and structures of dimethyltin(IV) complexes with N - and 0- donor ligands have
also been discussed by Aizawa et al. (1996).
The distribution diagram of the CH 3 Sn 3 + species in SSWE (Fig. 11.9) is quite different from the one showing the species in a non-interacting medium (Fig. 11.3). The forFig. 11.8. Distribution diagram
of R2Sn2+ in SSWE (single salt
BA) at T=25°C; [R=CH3].
Species:
(1) [(CH3hSn(OH)]+,
(2) [«CH3hSnlz(OHJ3]+'
(3) [(CH3hSn(OHh] ,
(4) [(CH3hSn(OHh1-,
(s) [(CH3hSnAtO.88~,
(6) [(CH 3 hSnA(OH)ro. 1l7 ,
(7) [(CH3hSnB(OHhto.1l7
Fig. 11.9. Distribution diagram
of CH3Sn H in SSWE (single salt
BA) at T = 25°C. Srecies:
(1) [CH3Sn(OHh] ,
(2) [CH3Sn(OHh]o,
(j). [(CH3Snh(OHlsl+,
(4) [CH3SnA(OHhr t . 1l7 ,
(s) [(CH 3 SnlzA(OHlsro. ll7 ,
(6) [CH3SnB(OH)4]+~·1l7
100r-----------------~--~~------_.
~
1: 50
III
rr.'"
4
6
8
10
12
pH
100.-----------------------------~--~
6
4
6
8
10
12
pH