

224
C. De Stefano . C. Foti . A. Gianguzza . S. Sammartano
On the basis of the above model, distribution diagrams have been drawn to evaluate the formation percentages of the various hydrolytic species in synthetic sea water
containing anion macro-components by also considering the association species with
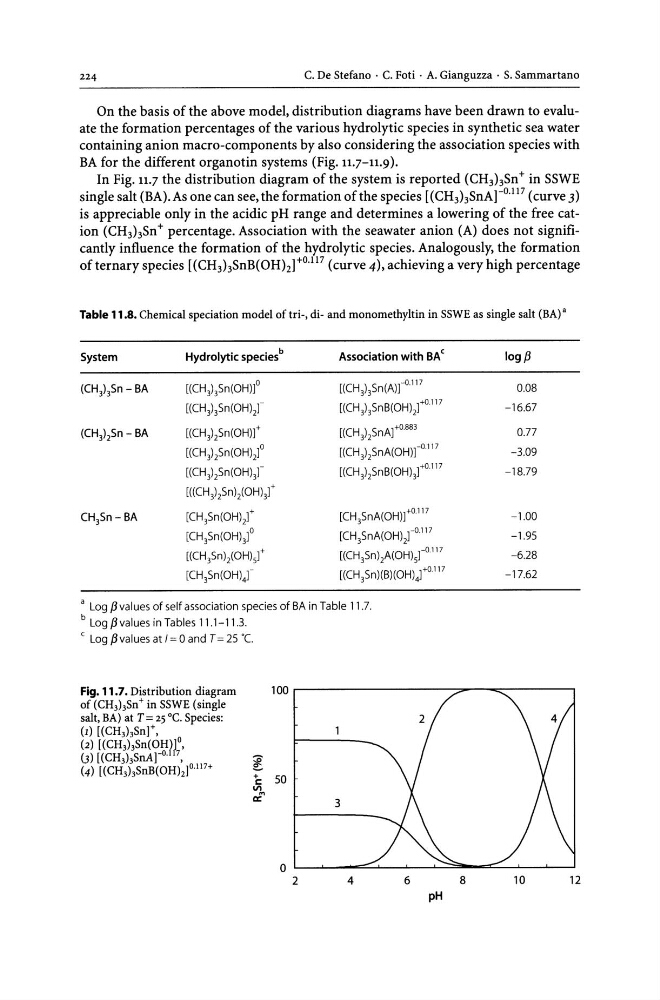
BA for the different organotin systems (Fig. 11.7-11.9).
In Fig. 11.7 the distribution diagram of the system is reported (CH3hSn + in SSWE
single salt (BA). As one can see, the formation of the species [(CH 3 hSnAro. ll7 (curve 3)
is appreciable only in the acidic pH range and determines a lowering of the free cation (CH3hSn + percentage. Association with the seawater anion (A) does not significantly influence the formation of the hydrolytic species. Analogously, the formation
of ternary species [( CH3hSnB( OHhto. ll7 (curve 4), achieving a very high percentage
Table 11.8. Chemical speciation model of tri-, di- and monomethyltin in SSWE as single salt (BA) a
System
Hydrolytic species
b
Association with BA C
10g,8
(CH3)3Sn - BA
[(CH)3Sn(OHl]o
[(CH)3Sn(AlrOl17
0.08
[(CH3l3Sn(OHl2]
[(CH3l3SnB(OHl/0117
-16.67
(CH3l2Sn - BA
[(CH 3 l 2 Sn(OHlt
[(CH3l2SnAt0883
0.77
[(C H 3 l 2 Sn(OHl/
[(CH3l2SnA(OHlrOl17
-3.09
[(CH3l2Sn(OHl3]
[(CH3l2SnB(OHl/Ol17
-18.79
[«CH 3 l 2 Snl 2 (OHl/
CH 3 Sn - BA
[CH 3 Sn(OHl/
[CH3SnA(OHlt0117
-1.00
[CH 3 Sn(OHl/
[CH3SnA(OHl2rOl17
-1.95
[(CH 3 Snl 2 (OH)st
[(CH3Sn)2A(OHlsr0117
-6.28
[CH 3 Sn(OHl 4 ]
[(CH3Snl(B)(OHl4tOl17
-17.62
a Log ,8values of self association species of BA in Table 11.7.
b Log,8 values in Tables 11.1-11.3.
CLog ,8 values at 1=0 and T = 25 0(,
Fig. 11.7. Distribution diagram
of (CH3hSn+ in SSWE (single
salt, BA) at T = 25°C. Species:
(1) [(CH3hSn]+,
100.-----------------~~--~-------.
(2) [(CH3hSn(OHllo,
(j) [(CH 3 hSnArO.i(7,
(4) [(CH 3 hSnB(OHlz]o.1l7+
~
1: 50
III
rr,'"
o
2
3
4
6
8
10
12
pH
C. De Stefano . C. Foti . A. Gianguzza . S. Sammartano
On the basis of the above model, distribution diagrams have been drawn to evaluate the formation percentages of the various hydrolytic species in synthetic sea water
containing anion macro-components by also considering the association species with
BA for the different organotin systems (Fig. 11.7-11.9).
In Fig. 11.7 the distribution diagram of the system is reported (CH3hSn + in SSWE
single salt (BA). As one can see, the formation of the species [(CH 3 hSnAro. ll7 (curve 3)
is appreciable only in the acidic pH range and determines a lowering of the free cation (CH3hSn + percentage. Association with the seawater anion (A) does not significantly influence the formation of the hydrolytic species. Analogously, the formation
of ternary species [( CH3hSnB( OHhto. ll7 (curve 4), achieving a very high percentage
Table 11.8. Chemical speciation model of tri-, di- and monomethyltin in SSWE as single salt (BA) a
System
Hydrolytic species
b
Association with BA C
10g,8
(CH3)3Sn - BA
[(CH)3Sn(OHl]o
[(CH)3Sn(AlrOl17
0.08
[(CH3l3Sn(OHl2]
[(CH3l3SnB(OHl/0117
-16.67
(CH3l2Sn - BA
[(CH 3 l 2 Sn(OHlt
[(CH3l2SnAt0883
0.77
[(C H 3 l 2 Sn(OHl/
[(CH3l2SnA(OHlrOl17
-3.09
[(CH3l2Sn(OHl3]
[(CH3l2SnB(OHl/Ol17
-18.79
[«CH 3 l 2 Snl 2 (OHl/
CH 3 Sn - BA
[CH 3 Sn(OHl/
[CH3SnA(OHlt0117
-1.00
[CH 3 Sn(OHl/
[CH3SnA(OHl2rOl17
-1.95
[(CH 3 Snl 2 (OH)st
[(CH3Sn)2A(OHlsr0117
-6.28
[CH 3 Sn(OHl 4 ]
[(CH3Snl(B)(OHl4tOl17
-17.62
a Log ,8values of self association species of BA in Table 11.7.
b Log,8 values in Tables 11.1-11.3.
CLog ,8 values at 1=0 and T = 25 0(,
Fig. 11.7. Distribution diagram
of (CH3hSn+ in SSWE (single
salt, BA) at T = 25°C. Species:
(1) [(CH3hSn]+,
100.-----------------~~--~-------.
(2) [(CH3hSn(OHllo,
(j) [(CH 3 hSnArO.i(7,
(4) [(CH 3 hSnB(OHlz]o.1l7+
~
1: 50
III
rr,'"
o
2
3
4
6
8
10
12
pH