

C.M.G. van den Berg
9.2
Distributions of Organic Metal Complexing Ligands
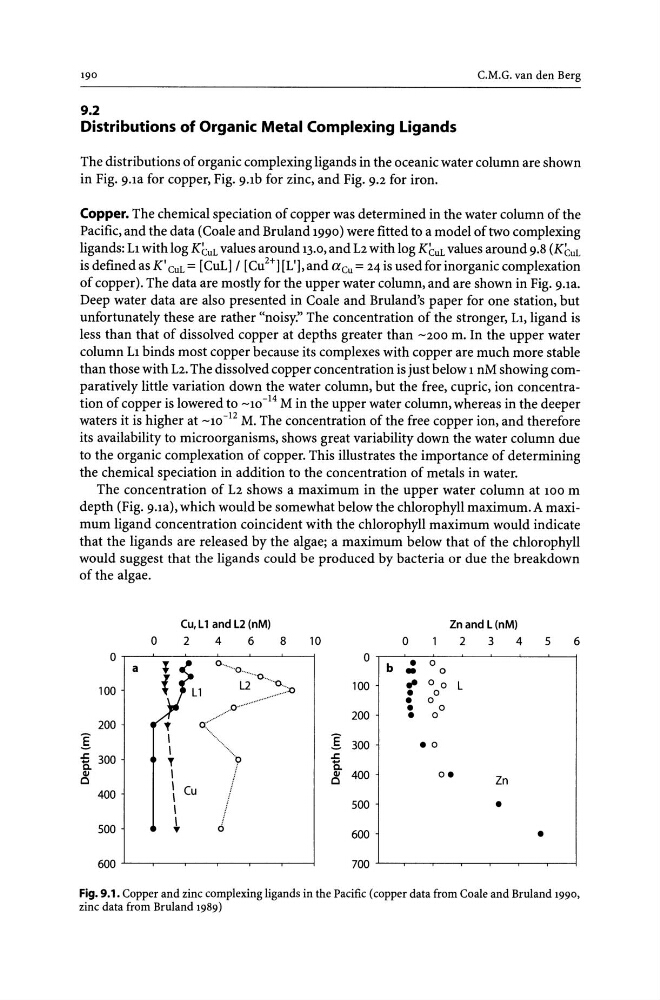
The distributions of organic complexing ligands in the oceanic water column are shown
in Fig. 9.1a for copper, Fig. 9.1b for zinc, and Fig. 9.2 for iron.
Copper. The chemical speciation of copper was determined in the water column of the
Pacific, and the data (Coale and Bruland 1990) were fitted to a model of two complexing
ligands: Ll with log KCuL values around 13.0, and L2 with log KCuL values around 9.8 (KcuL
is defined as K' CuL = [CuLl / [Cu 2 +][L'], and acu = 24 is used for inorganic complexation
of copper). The data are mostly for the upper water column, and are shown in Fig. 9.1a.
Deep water data are also presented in Coale and Bruland's paper for one station, but
unfortunately these are rather "noisy." The concentration of the stronger, 11, ligand is
less than that of dissolved copper at depths greater than -200 m. In the upper water
column 11 binds most copper because its complexes with copper are much more stable
than those with 12. The dissolved copper concentration is just below 1 nM showing comparatively little variation down the water column, but the free, cupric, ion concentration of copper is lowered to _10- 14 M in the upper water column, whereas in the deeper
waters it is higher at _10- 12 M. The concentration of the free copper ion, and therefore
its availability to microorganisms, shows great variability down the water column due
to the organic complexation of copper. This illustrates the importance of determining
the chemical speciation in addition to the concentration of metals in water.
The concentration of L2 shows a maximum in the upper water column at 100 m
depth (Fig. 9.1a), which would be somewhat below the chlorophyll maximum. A maximum ligand concentration coincident with the chlorophyll maximum would indicate
that the ligands are released by the algae; a maximum below that of the chlorophyll
would suggest that the ligands could be produced by bacteria or due the breakdown
of the algae.
Cu, L 1 and L2 (nM)
Znand L(nM)
0
2
4
6
8
10
0
2
3
4
5
6
0
0
0
•
0
a
·····0
b
-
0
·······0
L2
····0 ..
100
. . 0 0 L
100
..................
:0
•
0
•
0
0"
•
0
0·············
200
•
0
200
]:
......
]:
..•...•..•..•..
300
. 0
.r:. 300
'9
.r:.
...
...
a.
a.
III
III
0
0 400
o.
Zn
400
Cu
500
•
/
500
6
600
•
600
700
Fig. 9.1. Copper and zinc complexing ligands in the Pacific (copper data from Coale and Bruland 1990,
zinc data from Bruland 1989)
9.2
Distributions of Organic Metal Complexing Ligands
The distributions of organic complexing ligands in the oceanic water column are shown
in Fig. 9.1a for copper, Fig. 9.1b for zinc, and Fig. 9.2 for iron.
Copper. The chemical speciation of copper was determined in the water column of the
Pacific, and the data (Coale and Bruland 1990) were fitted to a model of two complexing
ligands: Ll with log KCuL values around 13.0, and L2 with log KCuL values around 9.8 (KcuL
is defined as K' CuL = [CuLl / [Cu 2 +][L'], and acu = 24 is used for inorganic complexation
of copper). The data are mostly for the upper water column, and are shown in Fig. 9.1a.
Deep water data are also presented in Coale and Bruland's paper for one station, but
unfortunately these are rather "noisy." The concentration of the stronger, 11, ligand is
less than that of dissolved copper at depths greater than -200 m. In the upper water
column 11 binds most copper because its complexes with copper are much more stable
than those with 12. The dissolved copper concentration is just below 1 nM showing comparatively little variation down the water column, but the free, cupric, ion concentration of copper is lowered to _10- 14 M in the upper water column, whereas in the deeper
waters it is higher at _10- 12 M. The concentration of the free copper ion, and therefore
its availability to microorganisms, shows great variability down the water column due
to the organic complexation of copper. This illustrates the importance of determining
the chemical speciation in addition to the concentration of metals in water.
The concentration of L2 shows a maximum in the upper water column at 100 m
depth (Fig. 9.1a), which would be somewhat below the chlorophyll maximum. A maximum ligand concentration coincident with the chlorophyll maximum would indicate
that the ligands are released by the algae; a maximum below that of the chlorophyll
would suggest that the ligands could be produced by bacteria or due the breakdown
of the algae.
Cu, L 1 and L2 (nM)
Znand L(nM)
0
2
4
6
8
10
0
2
3
4
5
6
0
0
0
•
0
a
·····0
b
-
0
·······0
L2
····0 ..
100
. . 0 0 L
100
..................
:0
•
0
•
0
0"
•
0
0·············
200
•
0
200
]:
......
]:
..•...•..•..•..
300
. 0
.r:. 300
'9
.r:.
...
...
a.
a.
III
III
0
0 400
o.
Zn
400
Cu
500
•
/
500
6
600
•
600
700
Fig. 9.1. Copper and zinc complexing ligands in the Pacific (copper data from Coale and Bruland 1990,
zinc data from Bruland 1989)