

166
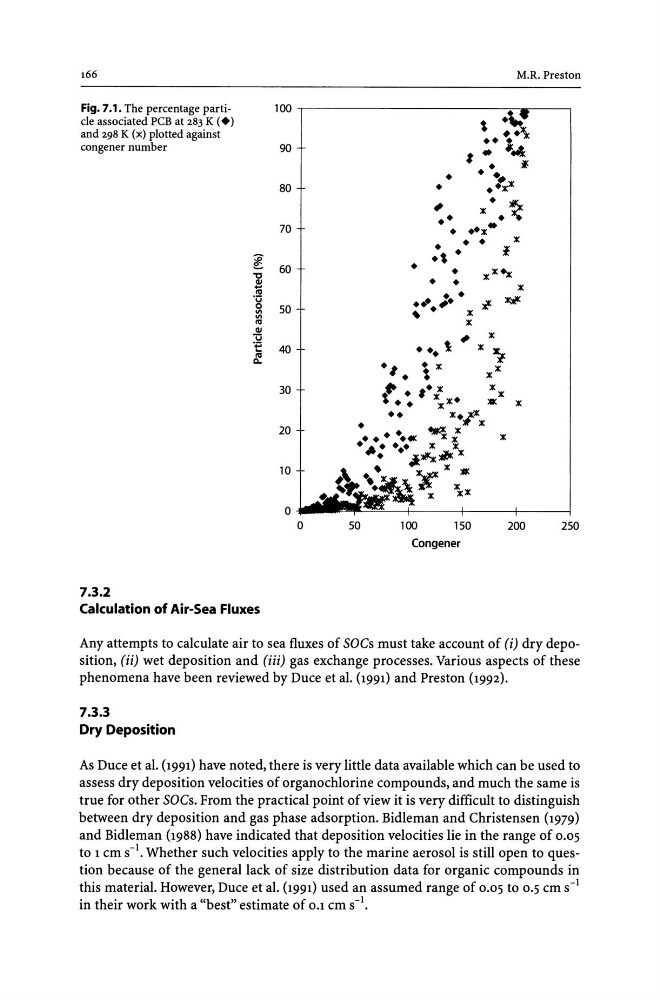
Fig. 7.1. The percentage particle associated PCB at 283 K (.)
and 298 K (~) plotted against
congener number
7.3.2
~
'0
! ,..
'0
0
VI
VI
,..
QI
U
°e
&.
Calculation of Air-Sea Fluxes
100
90
80
70
60
50
40
30
o
50
M.R. Preston
f
•
•
•• •
.'~
~. :1: • • ~
• ":1:*
•
• •
:I:
.~ •
I
• •
• •
• •
••• #.
~.
:I:
:I:
100
150
Congener
200
250
Any attempts to calculate air to sea fluxes of sacs must take account of (i) dry deposition, (ii) wet deposition and (iii) gas exchange processes. Various aspects of these
phenomena have been reviewed by Duce et al. (1991) and Preston (1992).
7.3.3
Dry Deposition
As Duce et al. (1991) have noted, there is very little data available which can be used to
assess dry deposition velocities of organochlorine compounds, and much the same is
true for other sacs. From the practical point of view it is very difficult to distinguish
between dry deposition and gas phase adsorption. Bidleman and Christensen (1979)
and Bidleman (1988) have indicated that deposition velocities lie in the range of 0.05
to 1 cm S-I. Whether such velocities apply to the marine aerosol is still open to question because of the general lack of size distribution data for organic compounds in
this material. However, Duce et al. (1991) used an assumed range of 0.05 to 0.5 cm S-1
in their work with a "best" estimate of 0.1 cm S-I.
Fig. 7.1. The percentage particle associated PCB at 283 K (.)
and 298 K (~) plotted against
congener number
7.3.2
~
'0
! ,..
'0
0
VI
VI
,..
QI
U
°e
&.
Calculation of Air-Sea Fluxes
100
90
80
70
60
50
40
30
o
50
M.R. Preston
f
•
•
•• •
.'~
~. :1: • • ~
• ":1:*
•
• •
:I:
.~ •
I
• •
• •
• •
••• #.
~.
:I:
:I:
100
150
Congener
200
250
Any attempts to calculate air to sea fluxes of sacs must take account of (i) dry deposition, (ii) wet deposition and (iii) gas exchange processes. Various aspects of these
phenomena have been reviewed by Duce et al. (1991) and Preston (1992).
7.3.3
Dry Deposition
As Duce et al. (1991) have noted, there is very little data available which can be used to
assess dry deposition velocities of organochlorine compounds, and much the same is
true for other sacs. From the practical point of view it is very difficult to distinguish
between dry deposition and gas phase adsorption. Bidleman and Christensen (1979)
and Bidleman (1988) have indicated that deposition velocities lie in the range of 0.05
to 1 cm S-I. Whether such velocities apply to the marine aerosol is still open to question because of the general lack of size distribution data for organic compounds in
this material. However, Duce et al. (1991) used an assumed range of 0.05 to 0.5 cm S-1
in their work with a "best" estimate of 0.1 cm S-I.