

160
M.R. Preston
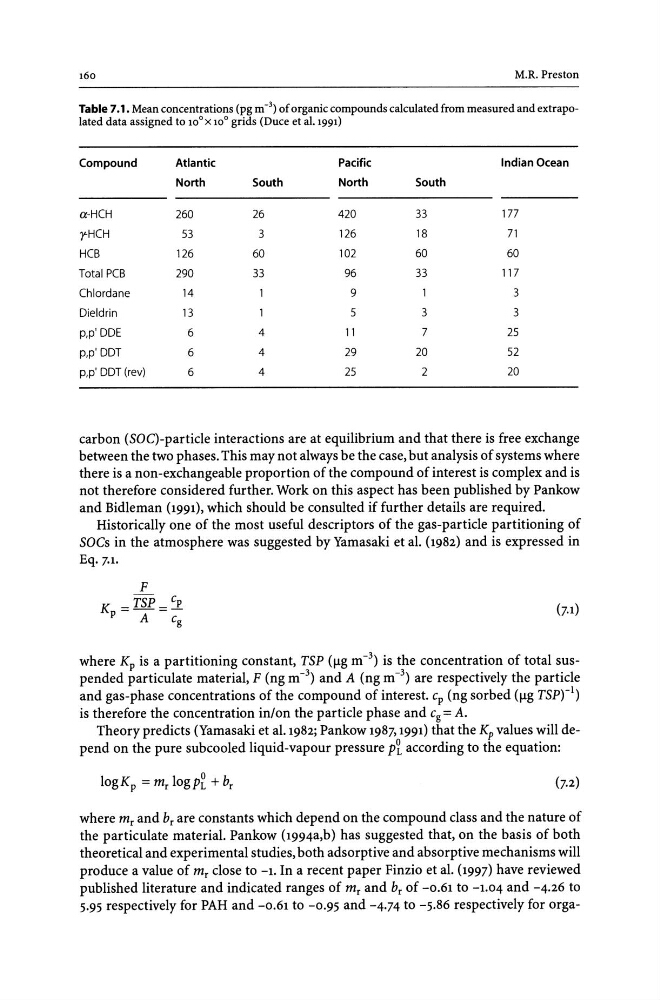
Table 7.1. Mean concentrations (pg m -3) of organic compounds calculated from measured and extrapolated data assigned to 10 0 X 10° grids (Duce et al.1991)
Compound
Atlantic
Pacific
Indian Ocean
North
South
North
South
a-HCH
260
26
420
33
177
y-HCH
53
3
126
18
71
HCB
126
60
102
60
60
Total PCB
290
33
96
33
117
Chlordane
14
9
3
Dieldrin
13
5
3
3
p,p'DDE
6
4
11
7
25
p,p'DDT
6
4
29
20
52
p,p' DDT (rev)
6
4
25
2
20
carbon (SaC)-particle interactions are at equilibrium and that there is free exchange
between the two phases. This may not always be the case, but analysis of systems where
there is a non -exchangeable proportion of the compound of interest is complex and is
not therefore considered further. Work on this aspect has been published by Pankow
and Bidleman (1991), which should be consulted if further details are required.
Historically one of the most useful descriptors of the gas-particle partitioning of
sacs in the atmosphere was suggested by Yamasaki et al. (1982) and is expressed in
Eq.7.1•
where Kp is a partitioning constant, TSP (jlg m- 3 ) is the concentration of total suspended particulate material, F (ng m- 3 ) and A (ng m- 3 ) are respectively the particle
and gas-phase concentrations of the compound of interest. c p (ng sorbed (jlg TSpr')
is therefore the concentration inIon the particle phase and c g = A.
Theory predicts (Yamasaki et al. 1982; Pankow 1987, 1991) that the Kp values will depend on the pure subcooled liquid-vapour pressure p1 according to the equation:
where mr and br are constants which depend on the compound class and the nature of
the particulate material. Pankow (1994a,b) has suggested that, on the basis of both
theoretical and experimental studies, both adsorptive and absorptive mechanisms will
produce a value of mr close to -1. In a recent paper Finzio et al. (1997) have reviewed
published literature and indicated ranges of mr and br of -0.61 to -1.04 and -4.26 to
5.95 respectively for PAH and -0.61 to -0.95 and -4.74 to -5.86 respectively for orga-
M.R. Preston
Table 7.1. Mean concentrations (pg m -3) of organic compounds calculated from measured and extrapolated data assigned to 10 0 X 10° grids (Duce et al.1991)
Compound
Atlantic
Pacific
Indian Ocean
North
South
North
South
a-HCH
260
26
420
33
177
y-HCH
53
3
126
18
71
HCB
126
60
102
60
60
Total PCB
290
33
96
33
117
Chlordane
14
9
3
Dieldrin
13
5
3
3
p,p'DDE
6
4
11
7
25
p,p'DDT
6
4
29
20
52
p,p' DDT (rev)
6
4
25
2
20
carbon (SaC)-particle interactions are at equilibrium and that there is free exchange
between the two phases. This may not always be the case, but analysis of systems where
there is a non -exchangeable proportion of the compound of interest is complex and is
not therefore considered further. Work on this aspect has been published by Pankow
and Bidleman (1991), which should be consulted if further details are required.
Historically one of the most useful descriptors of the gas-particle partitioning of
sacs in the atmosphere was suggested by Yamasaki et al. (1982) and is expressed in
Eq.7.1•
where Kp is a partitioning constant, TSP (jlg m- 3 ) is the concentration of total suspended particulate material, F (ng m- 3 ) and A (ng m- 3 ) are respectively the particle
and gas-phase concentrations of the compound of interest. c p (ng sorbed (jlg TSpr')
is therefore the concentration inIon the particle phase and c g = A.
Theory predicts (Yamasaki et al. 1982; Pankow 1987, 1991) that the Kp values will depend on the pure subcooled liquid-vapour pressure p1 according to the equation:
where mr and br are constants which depend on the compound class and the nature of
the particulate material. Pankow (1994a,b) has suggested that, on the basis of both
theoretical and experimental studies, both adsorptive and absorptive mechanisms will
produce a value of mr close to -1. In a recent paper Finzio et al. (1997) have reviewed
published literature and indicated ranges of mr and br of -0.61 to -1.04 and -4.26 to
5.95 respectively for PAH and -0.61 to -0.95 and -4.74 to -5.86 respectively for orga-