

CHAPTER 4 . Redox Processes in Anoxic Waters
121
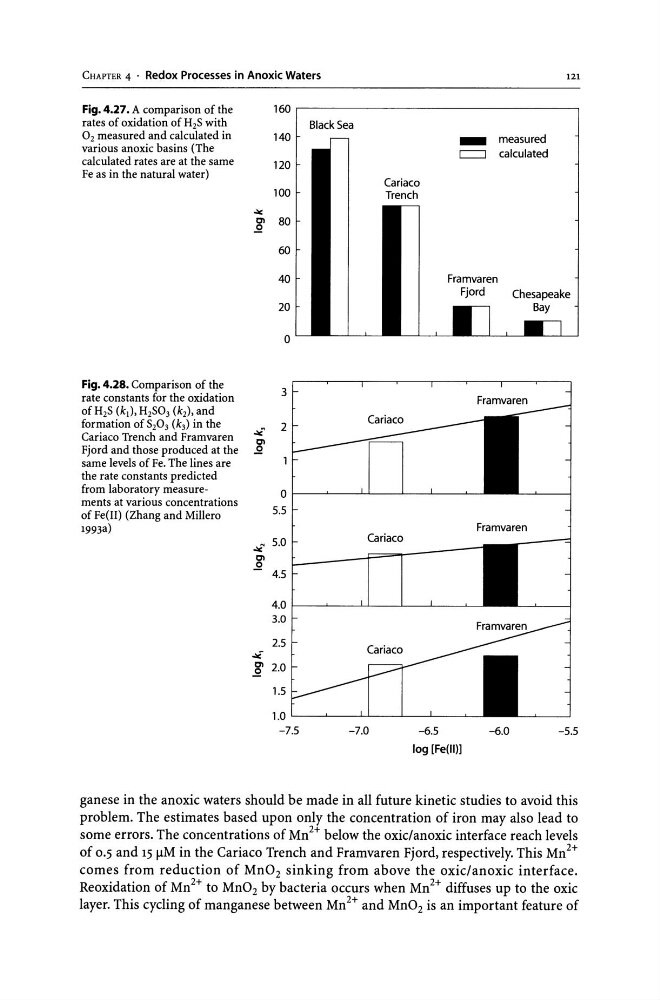
Fig. 4.27. A comparison of the
rates of oxidation of H2S with
O2 measured and calculated in
various anoxic basins (The
calculated rates are at the same
Fe as in the natural water)
Fig. 4.28. Comparison of the
rate constants for the oxidation
of H2S (k j ), H2S03 (k2), and
formation of S203 (k3) in the
Cariaco Trench and Framvaren
Fjord and those produced at the
same levels of Fe. The lines are
the rate constants predicted
from laboratory measurements at various concentrations
of Fe(1I) (Zhang and Millero
1993a)
160.----------------------------------.
140
120
100
...
01
80
..51
60
40
20
o
3
2
Black Sea
_
measured
C=::J calculated
Ot----....L----'-'-----....L----'-----~5.5
Framvaren
Cariaco
. . . N
5.0
~
L------f==I1------'
4.5
4.0
3.0
2.5
.;E
Cariaco
01 2.0
..51
1.5
1.0
-7.5
-7.0
-6.5
-6.0
log [Fe(lI}]
-5.5
ganese in the anoxic waters should be made in all future kinetic studies to avoid this
problem. The estimates based upon only the concentration of iron may also lead to
some errors. The concentrations of Mn2+ below the oxic/anoxic interface reach levels
of 0.5 and 15 IlM in the Cariaco Trench and Framvaren Fjord, respectively. This Mn2+
comes from reduction of Mn02 sinking from above the oxic/anoxic interface.
Reoxidation of Mn2+ to Mn02 by bacteria occurs when Mn2+ diffuses up to the oxic
layer. This cycling of manganese between Mn2+ and Mn02 is an important feature of
121
Fig. 4.27. A comparison of the
rates of oxidation of H2S with
O2 measured and calculated in
various anoxic basins (The
calculated rates are at the same
Fe as in the natural water)
Fig. 4.28. Comparison of the
rate constants for the oxidation
of H2S (k j ), H2S03 (k2), and
formation of S203 (k3) in the
Cariaco Trench and Framvaren
Fjord and those produced at the
same levels of Fe. The lines are
the rate constants predicted
from laboratory measurements at various concentrations
of Fe(1I) (Zhang and Millero
1993a)
160.----------------------------------.
140
120
100
...
01
80
..51
60
40
20
o
3
2
Black Sea
_
measured
C=::J calculated
Ot----....L----'-'-----....L----'-----~5.5
Framvaren
Cariaco
. . . N
5.0
~
L------f==I1------'
4.5
4.0
3.0
2.5
.;E
Cariaco
01 2.0
..51
1.5
1.0
-7.5
-7.0
-6.5
-6.0
log [Fe(lI}]
-5.5
ganese in the anoxic waters should be made in all future kinetic studies to avoid this
problem. The estimates based upon only the concentration of iron may also lead to
some errors. The concentrations of Mn2+ below the oxic/anoxic interface reach levels
of 0.5 and 15 IlM in the Cariaco Trench and Framvaren Fjord, respectively. This Mn2+
comes from reduction of Mn02 sinking from above the oxic/anoxic interface.
Reoxidation of Mn2+ to Mn02 by bacteria occurs when Mn2+ diffuses up to the oxic
layer. This cycling of manganese between Mn2+ and Mn02 is an important feature of