

CHAPTER 4 • Redox Processes in Anoxic Waters
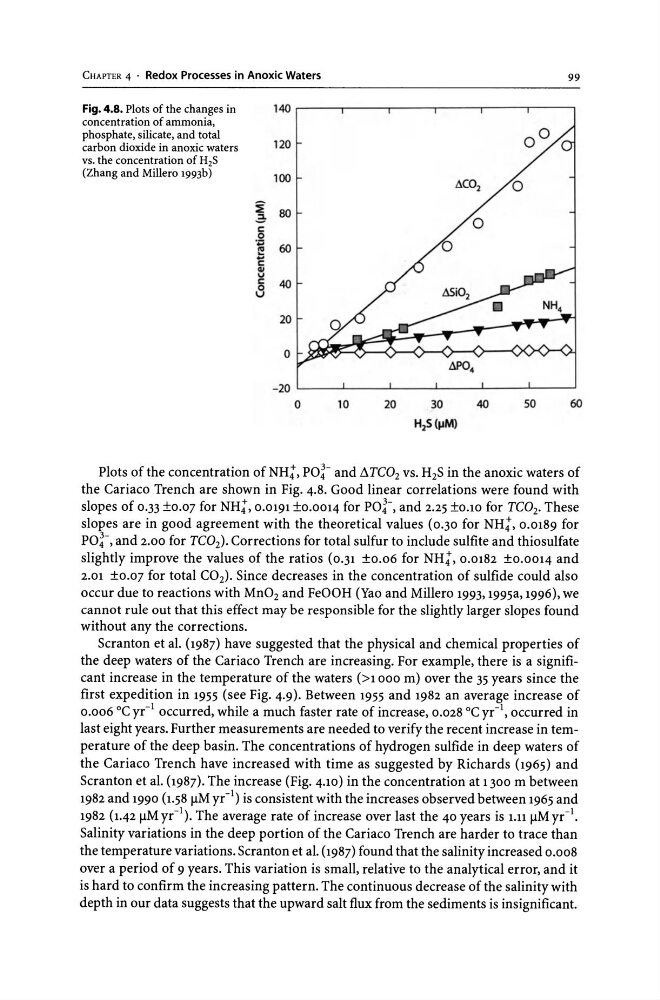
Fig. 4.8. Plots of the changes in
concentration of ammonia,
phosphate, silicate, and total
carbon dioxide in anoxic waters
vs. the concentration of H2S
(Zhang and Millero 1993b)
~
-= c;
.g
~
.... c;
QI
v
c;
0
u
140
120
100
80
60
40
20
0
- 20
0
99
Plots of the concentration ofNH;, pol-and ~TC02 vs. H 2 S in the anoxic waters of
the Cariaco Trench are shown in Fig. 4.8. Good linear correlations were found with
slopes of 0.33 ±0.07 for NH;, 0.0191 ±0.0014 for pol-, and 2.25 ±0.10 for TC02• These
slopes are in good agreement with the theoretical values (0.30 for NH;, 0.0189 for
pol-, and 2.00 for TC02). Corrections for total sulfur to include sulfite and thiosulfate
slightly improve the values of the ratios (0 .31 ±0.06 for NH;, 0.0182 ±0.0014 and
2.01 ±0.07 for total CO 2 ), Since decreases in the concentration of sulfide could also
occur due to reactions with Mn02 and FeOOH (Yao and Millero 1993, 1995a, 1996), we
cannot rule out that this effect may be responsible for the slightly larger slopes found
without any the corrections.
Scranton et al. (1987) have suggested that the physical and chemical properties of
the deep waters of the Cariaco Trench are increasing. For example, there is a significant increase in the temperature of the waters (>1000 m) over the 35 years since the
first expedition in 1955 (see Fig. 4.9). Between 1955 and 1982 an average increase of
0.006 °C yr- 1 occurred, while a much faster rate of increase, 0.028 °C yr- 1 , occurred in
last eight years. Further measurements are needed to verify the recent increase in temperature of the deep basin. The concentrations of hydrogen sulfide in deep waters of
the Cariaco Trench have increased with time as suggested by Richards (1965) and
Scranton et al. (1987). The increase (Fig. 4.10) in the concentration at 1300 m between
1982 and 1990 (1.58 11M yr- 1 ) is consistent with the increases observed between 1965 and
1982 (1.42 11M yr- 1 ). The average rate of increase over last the 40 years is 1.11 11M yr- 1 •
Salinity variations in the deep portion of the Cariaco Trench are harder to trace than
the temperature variations. Scranton et al. (1987) found that the salinity increased 0.008
over a period of 9 years. This variation is small, relative to the analytical error, and it
is hard to confirm the increasing pattern. The continuous decrease of the salinity with
depth in our data suggests that the upward salt flux from the sediments is insignificant.
Fig. 4.8. Plots of the changes in
concentration of ammonia,
phosphate, silicate, and total
carbon dioxide in anoxic waters
vs. the concentration of H2S
(Zhang and Millero 1993b)
~
-= c;
.g
~
.... c;
QI
v
c;
0
u
140
120
100
80
60
40
20
0
- 20
0
99
Plots of the concentration ofNH;, pol-and ~TC02 vs. H 2 S in the anoxic waters of
the Cariaco Trench are shown in Fig. 4.8. Good linear correlations were found with
slopes of 0.33 ±0.07 for NH;, 0.0191 ±0.0014 for pol-, and 2.25 ±0.10 for TC02• These
slopes are in good agreement with the theoretical values (0.30 for NH;, 0.0189 for
pol-, and 2.00 for TC02). Corrections for total sulfur to include sulfite and thiosulfate
slightly improve the values of the ratios (0 .31 ±0.06 for NH;, 0.0182 ±0.0014 and
2.01 ±0.07 for total CO 2 ), Since decreases in the concentration of sulfide could also
occur due to reactions with Mn02 and FeOOH (Yao and Millero 1993, 1995a, 1996), we
cannot rule out that this effect may be responsible for the slightly larger slopes found
without any the corrections.
Scranton et al. (1987) have suggested that the physical and chemical properties of
the deep waters of the Cariaco Trench are increasing. For example, there is a significant increase in the temperature of the waters (>1000 m) over the 35 years since the
first expedition in 1955 (see Fig. 4.9). Between 1955 and 1982 an average increase of
0.006 °C yr- 1 occurred, while a much faster rate of increase, 0.028 °C yr- 1 , occurred in
last eight years. Further measurements are needed to verify the recent increase in temperature of the deep basin. The concentrations of hydrogen sulfide in deep waters of
the Cariaco Trench have increased with time as suggested by Richards (1965) and
Scranton et al. (1987). The increase (Fig. 4.10) in the concentration at 1300 m between
1982 and 1990 (1.58 11M yr- 1 ) is consistent with the increases observed between 1965 and
1982 (1.42 11M yr- 1 ). The average rate of increase over last the 40 years is 1.11 11M yr- 1 •
Salinity variations in the deep portion of the Cariaco Trench are harder to trace than
the temperature variations. Scranton et al. (1987) found that the salinity increased 0.008
over a period of 9 years. This variation is small, relative to the analytical error, and it
is hard to confirm the increasing pattern. The continuous decrease of the salinity with
depth in our data suggests that the upward salt flux from the sediments is insignificant.