

CHAPTER 2 . The Chemical and Physical Properties of Marine Aerosols: An Introduction
49
7- 6
E
C\
5
3- 4
J!! 3
"'
~
Q.
2
"5
II>
.:,
'"
I:
0
2-Jan-91 3-Jul-91
2-Jan-92 2-Jul-92 l -Jan-93 3-Jul-93
l-Jan-94 3-Jul-94 2-Jan-95
0.08
0.07
~ 0.06
C\ 0.05
3- 0.04
« 0.03
::E 0.02
0.01
0.00
2-Jan-91 3-Jul-91
2-Jan-92 2-Jul-92 l -Jan-93 3-Jul-93 l-Jan-94 3-Jul-94 2-Jan-95
6
. . 5
E 4
C\
3- 3
J!!
l!!
2
.t:
1
Z
0
2-Jan -91 3-Jul-91
2-Jan-92 2-Jul-92 l -Jan-93 3-Jul-93 l -Jan-94 3-Jul-94 2-Jan-95
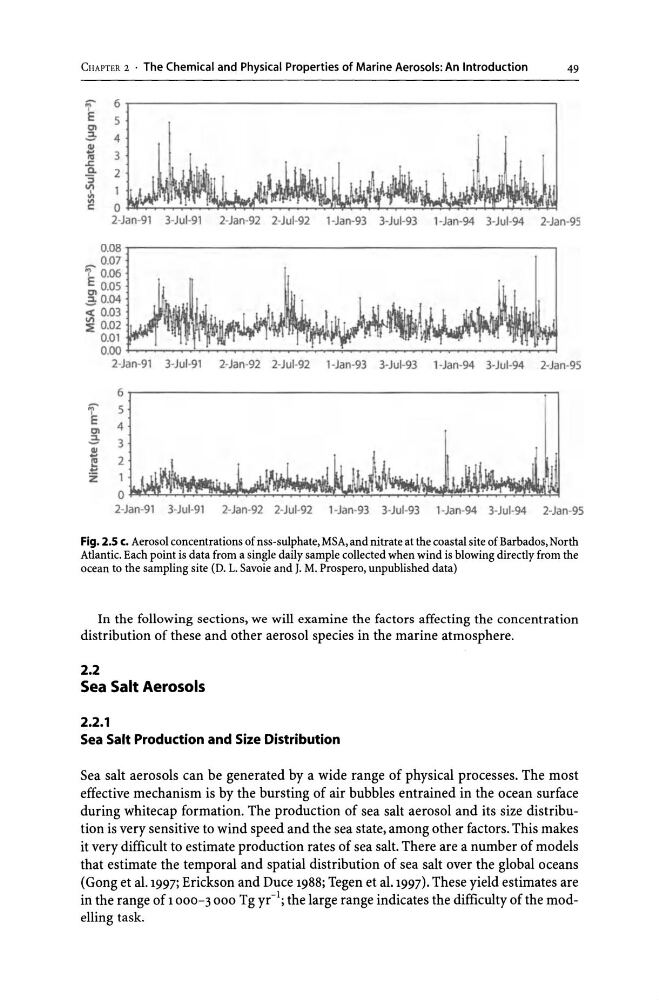
Fig. 2.S c. Aerosol concentrations of nss-sulphate, MSA, and nitrate at the coastal site of Barbados, North
Atlantic. Each point is data from a single daily sample collected when wind is blowing directly from the
ocean to the sampling site (D. L. Savoie and J. M. Prospero, unpublished data)
In the following sections, we will examine the factors affecting the concentration
distribution of these and other aerosol species in the marine atmosphere.
2.2
Sea Salt Aerosols
2.2.1
Sea Salt Production and Size Distribution
Sea salt aerosols can be generated by a wide range of physical processes. The most
effective mechanism is by the bursting of air bubbles entrained in the ocean surface
during whitecap formation. The production of sea salt aerosol and its size distribution is very sensitive to wind speed and the sea state, among other factors. This makes
it very difficult to estimate production rates of sea salt. There are a number of models
that estimate the temporal and spatial distribution of sea salt over the global oceans
(Gong et al. 1997; Erickson and Duce 1988; Tegen et al. 1997). These yield estimates are
in the range of 1 000-3 000 Tg yr- l ; the large range indicates the difficulty of the modelling task.
49
7- 6
E
C\
5
3- 4
J!! 3
"'
~
Q.
2
"5
II>
.:,
'"
I:
0
2-Jan-91 3-Jul-91
2-Jan-92 2-Jul-92 l -Jan-93 3-Jul-93
l-Jan-94 3-Jul-94 2-Jan-95
0.08
0.07
~ 0.06
C\ 0.05
3- 0.04
« 0.03
::E 0.02
0.01
0.00
2-Jan-91 3-Jul-91
2-Jan-92 2-Jul-92 l -Jan-93 3-Jul-93 l-Jan-94 3-Jul-94 2-Jan-95
6
. . 5
E 4
C\
3- 3
J!!
l!!
2
.t:
1
Z
0
2-Jan -91 3-Jul-91
2-Jan-92 2-Jul-92 l -Jan-93 3-Jul-93 l -Jan-94 3-Jul-94 2-Jan-95
Fig. 2.S c. Aerosol concentrations of nss-sulphate, MSA, and nitrate at the coastal site of Barbados, North
Atlantic. Each point is data from a single daily sample collected when wind is blowing directly from the
ocean to the sampling site (D. L. Savoie and J. M. Prospero, unpublished data)
In the following sections, we will examine the factors affecting the concentration
distribution of these and other aerosol species in the marine atmosphere.
2.2
Sea Salt Aerosols
2.2.1
Sea Salt Production and Size Distribution
Sea salt aerosols can be generated by a wide range of physical processes. The most
effective mechanism is by the bursting of air bubbles entrained in the ocean surface
during whitecap formation. The production of sea salt aerosol and its size distribution is very sensitive to wind speed and the sea state, among other factors. This makes
it very difficult to estimate production rates of sea salt. There are a number of models
that estimate the temporal and spatial distribution of sea salt over the global oceans
(Gong et al. 1997; Erickson and Duce 1988; Tegen et al. 1997). These yield estimates are
in the range of 1 000-3 000 Tg yr- l ; the large range indicates the difficulty of the modelling task.