

48
J. M. Prospero
~
18~1-------------------------------------------'----'
E 16
~ 14
a- 12
~ 10
~
8
E- 6
~
4
~ 6 m~v~t;.!Il~rw:, ~.'~I~.;~ml'~.J,1 ~,!""'i.tn ":"'~·~·~1
2-Jan-91
3-Jul-91
2-Jan-92 2-Jul-92 Han-93 3-Jul-93 1-Jan-94 3-Jul-94 2-Jan-95
0.25 ~
;;;- 0.20
E ~ 0.15
2< 0.10
VI
~~
.
.
tJAl!1'.!, 'l7:t't~IIIT r''1''-J.Il~'IJ.·: 'r~ l-h.-f /fj,,,~
0.00
,
' "
, A
'
~
01
a.~
z
2-Jan-91 3-Jul-91
2-Jan -92 2-Jul-92 1-Jan -93 3-Jul-93
l-Jan-94 3-Jul-94 2-Jan-95
8,
7
6
5
4
3
2
1
or,'"
,",.,-,",,,.;'
· , . . . . . . . ft-,-h"·7·.r,·· ·1· ~""- · . -'r'.,. - lj~··--,r-""-V'1
2-Jan-91 3-Jul-91
2-Jan-92 2-Jul-92
, -Jan-93 3-Jul-93
1-Jan-94 3-Jul-94 2-Jan-95
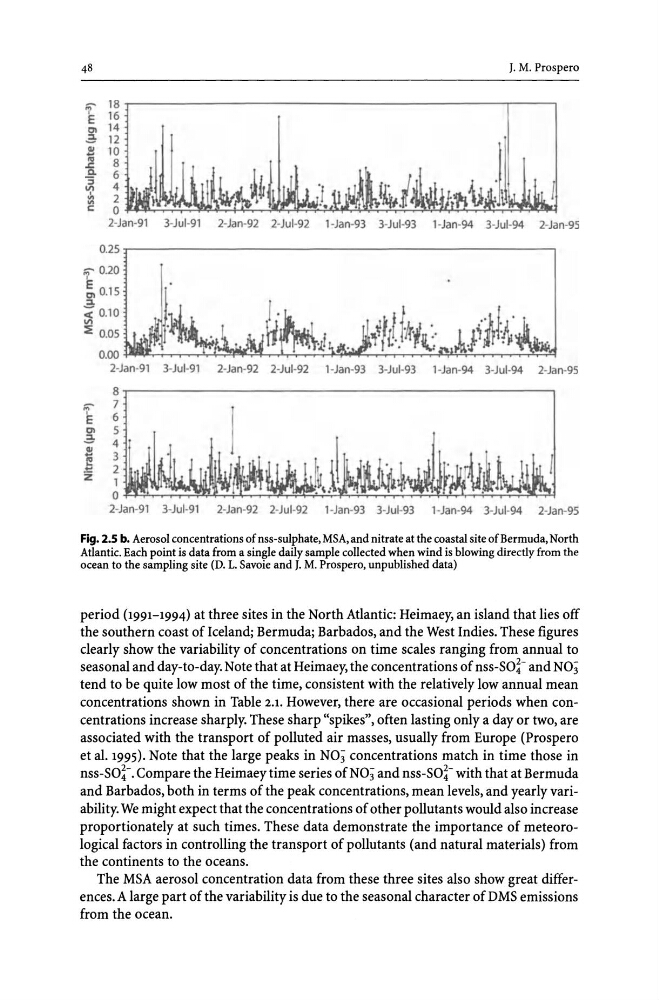
Fig. 2.5 b. Aerosol concentrations of nss-sulphate, MSA, and nitrate at the coastal site of Bermuda, North
Atlantic. Each point is data from a single daily sample collected when wind is blowing directly from the
ocean to the sampling site (D. 1. Savoie and J. M. Prospero, unpublished data)
period (1991-1994) at three sites in the North Atlantic: Heimaey, an island that lies off
the southern coast of Iceland; Bermuda; Barbados, and the West Indies. These figures
clearly show the variability of concentrations on time scales ranging from annual to
seasonal and day-to-day. Note that at Heimaey, the concentrations of nss-SO;- and NO;
tend to be quite low most of the time, consistent with the relatively low annual mean
concentrations shown in Table 2.1. However, there are occasional periods when concentrations increase sharply. These sharp "spikes", often lasting only a day or two, are
associated with the transport of polluted air masses, usually from Europe (Prospero
et al. 1995). Note that the large peaks in NO; concentrations match in time those in
nss-SO~-. Compare the Heimaey time series of NO; and nss-SO~- with that at Bermuda
and Barbados, both in terms of the peak concentrations, mean levels, and yearly variability. We might expect that the concentrations of other pollutants would also increase
proportionately at such times. These data demonstrate the importance of meteorological factors in controlling the transport of pollutants (and natural materials) from
the continents to the oceans.
The MSA aerosol concentration data from these three sites also show great differences. A large part of the variability is due to the seasonal character of DMS emissions
from the ocean.
J. M. Prospero
~
18~1-------------------------------------------'----'
E 16
~ 14
a- 12
~ 10
~
8
E- 6
~
4
~ 6 m~v~t;.!Il~rw:, ~.'~I~.;~ml'~.J,1 ~,!""'i.tn ":"'~·~·~1
2-Jan-91
3-Jul-91
2-Jan-92 2-Jul-92 Han-93 3-Jul-93 1-Jan-94 3-Jul-94 2-Jan-95
0.25 ~
;;;- 0.20
E ~ 0.15
2< 0.10
VI
~~
.
.
tJAl!1'.!, 'l7:t't~IIIT r''1''-J.Il~'IJ.·: 'r~ l-h.-f /fj,,,~
0.00
,
' "
, A
'
~
01
a.~
z
2-Jan-91 3-Jul-91
2-Jan -92 2-Jul-92 1-Jan -93 3-Jul-93
l-Jan-94 3-Jul-94 2-Jan-95
8,
7
6
5
4
3
2
1
or,'"
,",.,-,",,,.;'
· , . . . . . . . ft-,-h"·7·.r,·· ·1· ~""- · . -'r'.,. - lj~··--,r-""-V'1
2-Jan-91 3-Jul-91
2-Jan-92 2-Jul-92
, -Jan-93 3-Jul-93
1-Jan-94 3-Jul-94 2-Jan-95
Fig. 2.5 b. Aerosol concentrations of nss-sulphate, MSA, and nitrate at the coastal site of Bermuda, North
Atlantic. Each point is data from a single daily sample collected when wind is blowing directly from the
ocean to the sampling site (D. 1. Savoie and J. M. Prospero, unpublished data)
period (1991-1994) at three sites in the North Atlantic: Heimaey, an island that lies off
the southern coast of Iceland; Bermuda; Barbados, and the West Indies. These figures
clearly show the variability of concentrations on time scales ranging from annual to
seasonal and day-to-day. Note that at Heimaey, the concentrations of nss-SO;- and NO;
tend to be quite low most of the time, consistent with the relatively low annual mean
concentrations shown in Table 2.1. However, there are occasional periods when concentrations increase sharply. These sharp "spikes", often lasting only a day or two, are
associated with the transport of polluted air masses, usually from Europe (Prospero
et al. 1995). Note that the large peaks in NO; concentrations match in time those in
nss-SO~-. Compare the Heimaey time series of NO; and nss-SO~- with that at Bermuda
and Barbados, both in terms of the peak concentrations, mean levels, and yearly variability. We might expect that the concentrations of other pollutants would also increase
proportionately at such times. These data demonstrate the importance of meteorological factors in controlling the transport of pollutants (and natural materials) from
the continents to the oceans.
The MSA aerosol concentration data from these three sites also show great differences. A large part of the variability is due to the seasonal character of DMS emissions
from the ocean.