

44
J. M. Prospero
January
90 0 N
6QoN
30 0 N
0
30° 5
./
60° 5
90° 5
180
120' W
60 0 W
o
60 0 E
120" E
180
July
90 0 N
60 0 N
30 0 N
0
30" 5
./
6O"S
90°5
180
1200W
60 0 W
o
60 0 E
120" E
180
Number of days (AAI > 0.7)
o
7
14
21
28
31
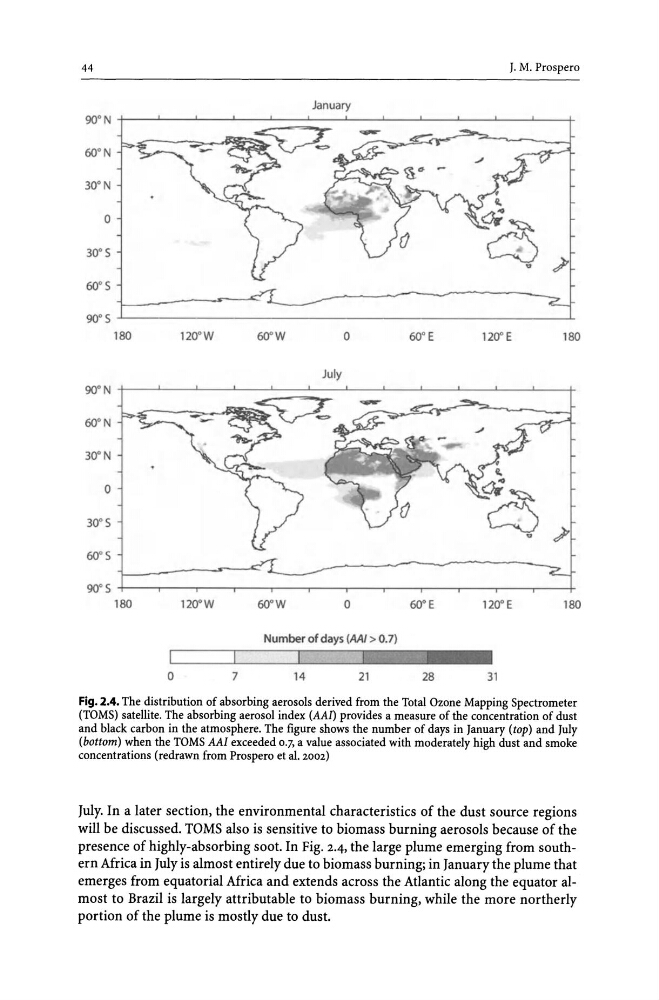
Fig. 2.4. The distribution of absorbing aerosols derived from the Total Ozone Mapping Spectrometer
(TOMS) satellite. The absorbing aerosol index (AAI) provides a measure of the concentration of dust
and black carbon in the atmosphere. The figure shows the number of days in January (top) and July
(bottom) when the TOMS AAI exceeded 0.7, a value associated with moderately high dust and smoke
concentrations (redrawn from Prospero et al. 2002)
July. In a later section, the environmental characteristics of the dust source regions
will be discussed. TOMS also is sensitive to biomass burning aerosols because of the
presence of highly-absorbing soot. In Fig. 2.4, the large plume emerging from southern Africa in July is almost entirely due to biomass burning; in January the plume that
emerges from equatorial Africa and extends across the Atlantic along the equator almost to Brazil is largely attributable to biomass burning, while the more northerly
portion of the plume is mostly due to dust.
J. M. Prospero
January
90 0 N
6QoN
30 0 N
0
30° 5
./
60° 5
90° 5
180
120' W
60 0 W
o
60 0 E
120" E
180
July
90 0 N
60 0 N
30 0 N
0
30" 5
./
6O"S
90°5
180
1200W
60 0 W
o
60 0 E
120" E
180
Number of days (AAI > 0.7)
o
7
14
21
28
31
Fig. 2.4. The distribution of absorbing aerosols derived from the Total Ozone Mapping Spectrometer
(TOMS) satellite. The absorbing aerosol index (AAI) provides a measure of the concentration of dust
and black carbon in the atmosphere. The figure shows the number of days in January (top) and July
(bottom) when the TOMS AAI exceeded 0.7, a value associated with moderately high dust and smoke
concentrations (redrawn from Prospero et al. 2002)
July. In a later section, the environmental characteristics of the dust source regions
will be discussed. TOMS also is sensitive to biomass burning aerosols because of the
presence of highly-absorbing soot. In Fig. 2.4, the large plume emerging from southern Africa in July is almost entirely due to biomass burning; in January the plume that
emerges from equatorial Africa and extends across the Atlantic along the equator almost to Brazil is largely attributable to biomass burning, while the more northerly
portion of the plume is mostly due to dust.