

42
~
" ~
o
o
0 ()
.
o~.
o Q ¢J \:.?.,
J. M. Prospero
Q
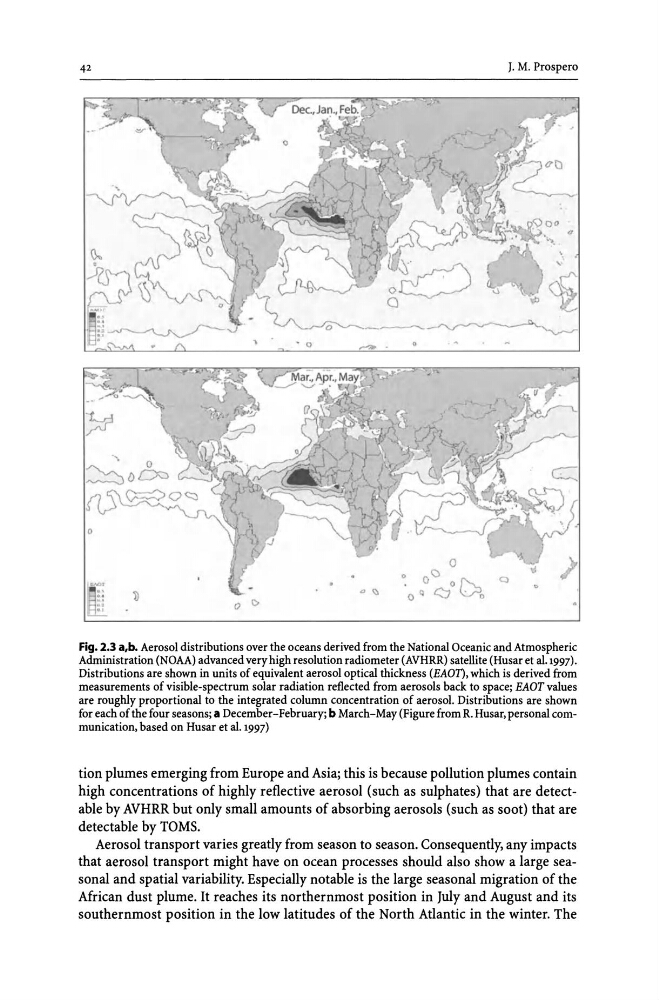
Fig. 2.3 a,b. Aerosol distributions over the oceans derived from the National Oceanic and Atmospheric
Administration (NOAA) advanced very high resolution radiometer (AVHRR) satellite (Husar et al.1997).
Distributions are shown in units of equivalent aerosol optical thickness (BAOT) , which is derived from
measurements of visible-spectrum solar radiation reflected from aerosols back to space; BAOT values
are roughly proportional to the integrated column concentration of aerosol. Distributions are shown
for each of the four seasons; a December-February; b March-May (Figure from R. Husar, personal communication, based on Husar et al.1997)
tion plumes emerging from Europe and Asia; this is because pollution plumes contain
high concentrations of highly reflective aerosol (such as sulphates) that are detectable by AVHRR but only small amounts of absorbing aerosols (such as soot) that are
detectable by TOMS.
Aerosol transport varies greatly from season to season. Consequently, any impacts
that aerosol transport might have on ocean processes should also show a large seasonal and spatial variability. Especially notable is the large seasonal migration of the
African dust plume. It reaches its northernmost position in July and August and its
southernmost position in the low latitudes of the North Atlantic in the winter. The
~
" ~
o
o
0 ()
.
o~.
o Q ¢J \:.?.,
J. M. Prospero
Q
Fig. 2.3 a,b. Aerosol distributions over the oceans derived from the National Oceanic and Atmospheric
Administration (NOAA) advanced very high resolution radiometer (AVHRR) satellite (Husar et al.1997).
Distributions are shown in units of equivalent aerosol optical thickness (BAOT) , which is derived from
measurements of visible-spectrum solar radiation reflected from aerosols back to space; BAOT values
are roughly proportional to the integrated column concentration of aerosol. Distributions are shown
for each of the four seasons; a December-February; b March-May (Figure from R. Husar, personal communication, based on Husar et al.1997)
tion plumes emerging from Europe and Asia; this is because pollution plumes contain
high concentrations of highly reflective aerosol (such as sulphates) that are detectable by AVHRR but only small amounts of absorbing aerosols (such as soot) that are
detectable by TOMS.
Aerosol transport varies greatly from season to season. Consequently, any impacts
that aerosol transport might have on ocean processes should also show a large seasonal and spatial variability. Especially notable is the large seasonal migration of the
African dust plume. It reaches its northernmost position in July and August and its
southernmost position in the low latitudes of the North Atlantic in the winter. The