

CHAPTER 22 • Organic Matter Sources and Dynamics in Adriatic Coastal Waters
481
21 ±5 and 18 ±6% of DOC in the June and February cruises, respectively. The LCOC
fraction contributed 41 ±7 and 46 ±6% to the overall DOC in the June and February
cruises. Both these colloidal classes were tightly correlated to DOC (Pettine et al. 2001).
Total dissolved carbohydrate concentrations from the two investigated areas
and various cruises ranged from 6.0 to 72.4 JlM in terms of carbon (average 18.3 ±12.0)
and were tightly correlated to DOC. The entire data set (JlM) was described by (p < 0.001):
TDCHO = -10.46 (±2.22) + 0.28 (±0.02) DOC; n = 155; r = 0.74; s.d. = 8.07 (22.1)
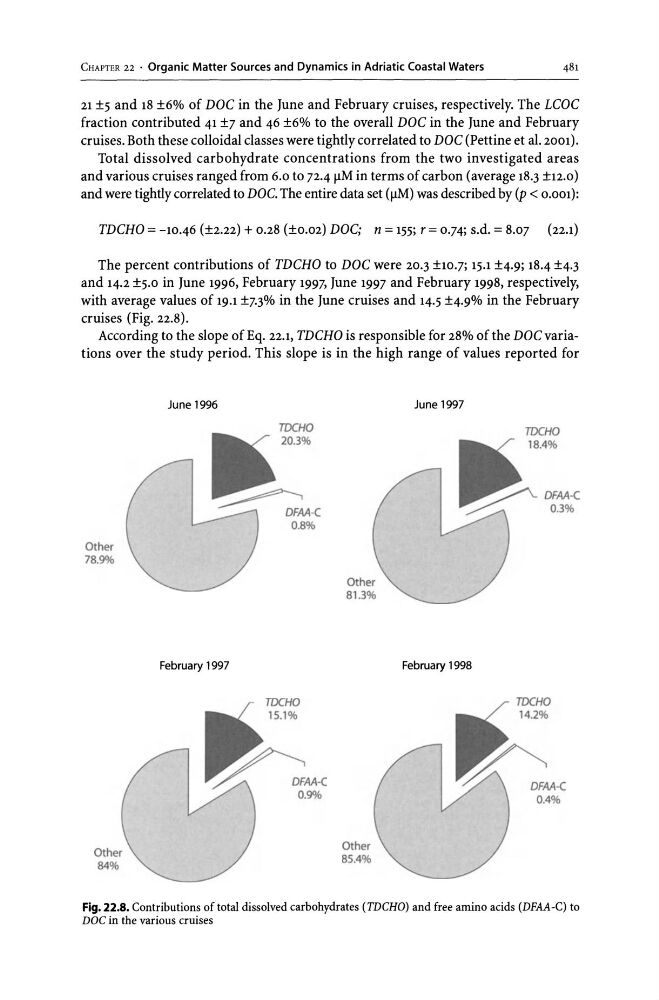
The percent contributions of TDCHO to DOC were 20.3 ±1O.7; 15-1 ±4.9; 18.4 ±4.3
and 14.2 ±5.0 in June 1996, February 1997, June 1997 and February 1998, respectively,
with average values of 19.1 ±7.3% in the June cruises and 14.5 ±4.9% in the February
cruises (Fig. 22.8).
According to the slope of Eq. 22.1, TDCHO is responsible for 28% of the DOC variations over the study period. This slope is in the high range of values reported for
Other
78.9%
Other
84%
June 1996
February 1997
TOCHO
20.3%
0.8%
TDCHO
15.1%
Other
81.3%
Other
85.4%
June 1997
February 1998
TDCHO
18.4%
TOCHO
14.2%
Fig. 22.8. Contributions of total dissolved carbohydrates (TDCHO) and free amino acids (DFAA -C) to
DOC in the various cruises
481
21 ±5 and 18 ±6% of DOC in the June and February cruises, respectively. The LCOC
fraction contributed 41 ±7 and 46 ±6% to the overall DOC in the June and February
cruises. Both these colloidal classes were tightly correlated to DOC (Pettine et al. 2001).
Total dissolved carbohydrate concentrations from the two investigated areas
and various cruises ranged from 6.0 to 72.4 JlM in terms of carbon (average 18.3 ±12.0)
and were tightly correlated to DOC. The entire data set (JlM) was described by (p < 0.001):
TDCHO = -10.46 (±2.22) + 0.28 (±0.02) DOC; n = 155; r = 0.74; s.d. = 8.07 (22.1)
The percent contributions of TDCHO to DOC were 20.3 ±1O.7; 15-1 ±4.9; 18.4 ±4.3
and 14.2 ±5.0 in June 1996, February 1997, June 1997 and February 1998, respectively,
with average values of 19.1 ±7.3% in the June cruises and 14.5 ±4.9% in the February
cruises (Fig. 22.8).
According to the slope of Eq. 22.1, TDCHO is responsible for 28% of the DOC variations over the study period. This slope is in the high range of values reported for
Other
78.9%
Other
84%
June 1996
February 1997
TOCHO
20.3%
0.8%
TDCHO
15.1%
Other
81.3%
Other
85.4%
June 1997
February 1998
TDCHO
18.4%
TOCHO
14.2%
Fig. 22.8. Contributions of total dissolved carbohydrates (TDCHO) and free amino acids (DFAA -C) to
DOC in the various cruises