

436
1.0
0.9
0.8
0.7
0.6
~0.5
0.4
0.3
0.2
t+
0.1
0.0
0
00
+
++" "+
" ,I""
/0
Atlantic --+-1 ~
+
+
,1"ao + ' ~
Indic
+ 0 .. "
"'~(jo
+
' +""':A>o
.y.{ -¥. -;r::J" 0
0''::1 , . "
0
,,0
0
,~
~
,.! qa 0
Pacific
'+
,,"
,. ,
, .A , "', "0 0
1(,'
0
+' !;IJ
, ,
DO
o 0
<>
5
10
15
Annual mean SST,O m (OC)
+
o
o
20
S. Wakeham
+
Atlantic Ocean
Indian Ocean
Pacific Ocean
25
30
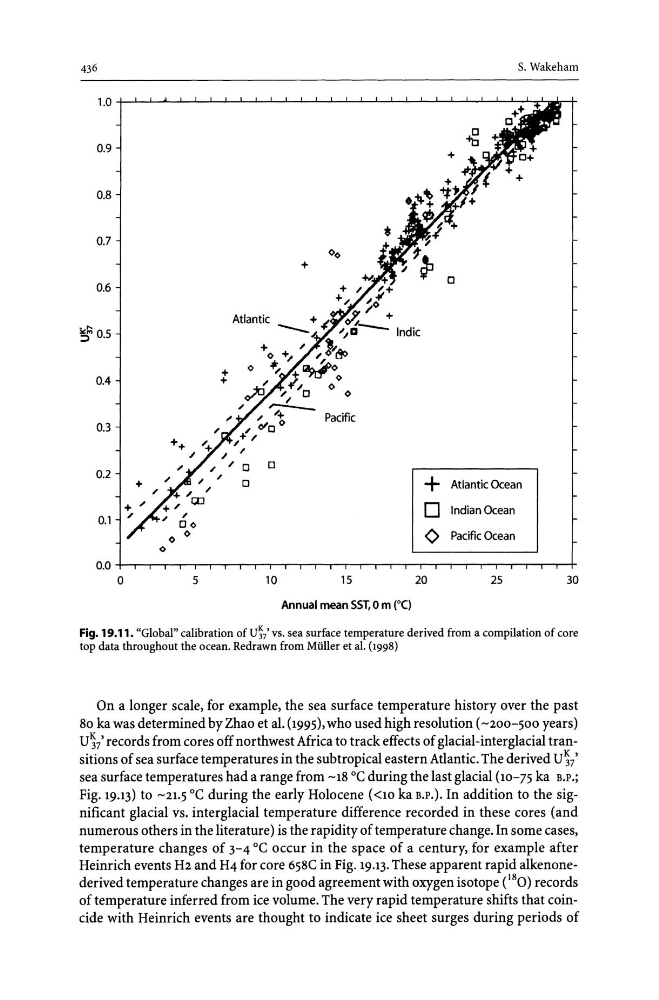
Fig. 19.11. "Global" calibration of u~/ vs. sea surface temperature derived from a compilation of core
top data throughout the ocean. Redrawn from Muller et al. (1998)
On a longer scale, for example, the sea surface temperature history over the past
80 ka was determined by Zhao et al. (1995), who used high resolution (-200-500 years)
U~/ records from cores off northwest Africa to track effects of glacial-interglacial transitions of sea surface temperatures in the subtropical eastern Atlantic. The derived U~/
sea surface temperatures had a range from -18°C during the last glacial (10-75 ka B.P.;
Fig. 19.13) to -21.5 °C during the early Holocene «10 ka B.P.). In addition to the significant glacial vs. interglacial temperature difference recorded in these cores (and
numerous others in the literature) is the rapidity of temperature change. In some cases,
temperature changes of 3-4 °C occur in the space of a century, for example after
Heinrich events H2 and H4 for core 658C in Fig. 19.13. These apparent rapid alkenonederived temperature changes are in good agreement with oxygen isotope (180 ) records
of temperature inferred from ice volume. The very rapid temperature shifts that coincide with Heinrich events are thought to indicate ice sheet surges during periods of
1.0
0.9
0.8
0.7
0.6
~0.5
0.4
0.3
0.2
t+
0.1
0.0
0
00
+
++" "+
" ,I""
/0
Atlantic --+-1 ~
+
+
,1"ao + ' ~
Indic
+ 0 .. "
"'~(jo
+
' +""':A>o
.y.{ -¥. -;r::J" 0
0''::1 , . "
0
,,0
0
,~
~
,.! qa 0
Pacific
'+
,,"
,. ,
, .A , "', "0 0
1(,'
0
+' !;IJ
, ,
DO
o 0
<>
5
10
15
Annual mean SST,O m (OC)
+
o
o
20
S. Wakeham
+
Atlantic Ocean
Indian Ocean
Pacific Ocean
25
30
Fig. 19.11. "Global" calibration of u~/ vs. sea surface temperature derived from a compilation of core
top data throughout the ocean. Redrawn from Muller et al. (1998)
On a longer scale, for example, the sea surface temperature history over the past
80 ka was determined by Zhao et al. (1995), who used high resolution (-200-500 years)
U~/ records from cores off northwest Africa to track effects of glacial-interglacial transitions of sea surface temperatures in the subtropical eastern Atlantic. The derived U~/
sea surface temperatures had a range from -18°C during the last glacial (10-75 ka B.P.;
Fig. 19.13) to -21.5 °C during the early Holocene «10 ka B.P.). In addition to the significant glacial vs. interglacial temperature difference recorded in these cores (and
numerous others in the literature) is the rapidity of temperature change. In some cases,
temperature changes of 3-4 °C occur in the space of a century, for example after
Heinrich events H2 and H4 for core 658C in Fig. 19.13. These apparent rapid alkenonederived temperature changes are in good agreement with oxygen isotope (180 ) records
of temperature inferred from ice volume. The very rapid temperature shifts that coincide with Heinrich events are thought to indicate ice sheet surges during periods of