

CHAPTER 19 . Palaeoenvironmental Reconstructions
427
Gofii et al. 1998). However, significantly different results may be obtained depending
on the choice of biomarker(s). For example, Prahl et al. (1994) estimated that terrigenous OC is a minor component (::;10%) in continental slope sediments on the Washington (USA) margin based on lignin phenol concentrations and l3C of bulk ~C, but a
calculation using n-alkane concentrations and l3C of bulk OC suggested a significantly
higher input (30%).
Better still is measurement of biomarker specific isotopic compositions (Hayes et al.
1990). Compound-specific isotope analyses (CSIA) are now a common tool employed
by organic geochemists. A powerful application of CSIA has been in using n-alkanes
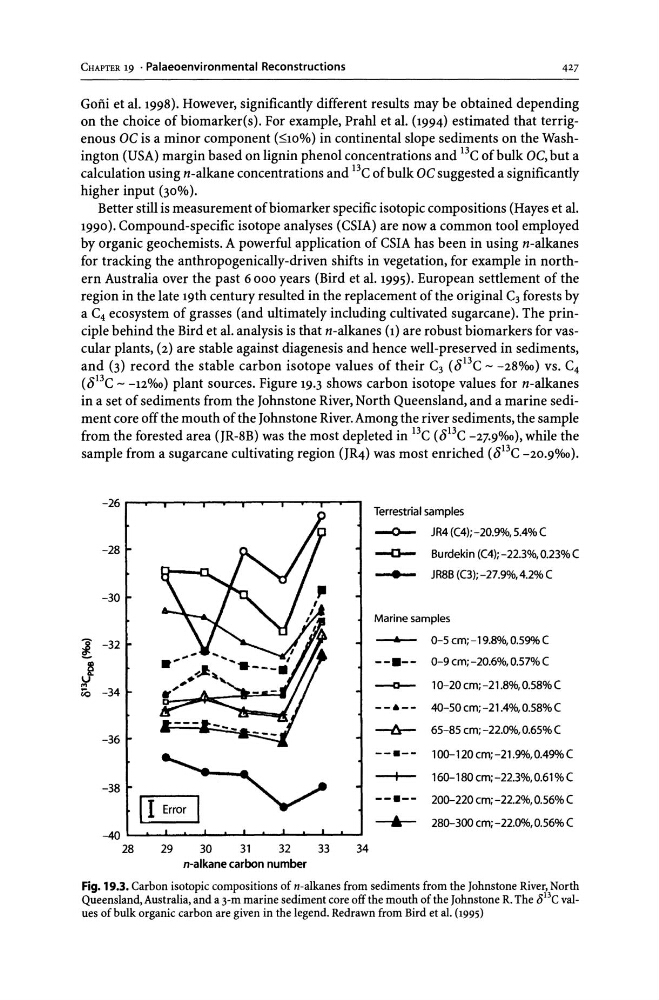
for tracking the anthropogenically-driven shifts in vegetation, for example in northern Australia over the past 6000 years (Bird et al. 1995). European settlement of the
region in the late 19th century resulted in the replacement of the original C3 forests by
a C 4 ecosystem of grasses (and ultimately including cultivated sugarcane). The principle behind the Bird et al. analysis is that n-alkanes (1) are robust biomarkers for vascular plants, (2) are stable against diagenesis and hence well-preserved in sediments,
and (3) record the stable carbon isotope values of their C 3 (8l3C - -280/00) vs. C 4
(8 13 C - -12%0) plant sources. Figure 19.3 shows carbon isotope values for n-alkanes
in a set of sediments from the Johnstone River, North Queensland, and a marine sediment core off the mouth of the Johnstone River. Among the river sediments, the sample
from tlIe forested area (JR-8B) was the most depleted in 13C (8 13 C -27.9%0), while the
sample from a sugarcane cultivating region (JR4) was most enriched (813C -20.90/00).
-26.
Terrestrial samples
--0- JR4 «(4); -20.9%, 5.4% (
-28 ~
n
//
~ --0- Burdekin «(4); -22.3%, 0.23% (
---JR8B (C3); -27.9%,4.2% (
-30 ~ ~
'"
-/.'~ 1 Marine samples
,
-32 t
1
-.to-- 0-5 cm; -19.8%, 0.59% (
--.-- 0-9 cm;-20.6%, 0.57% (
- - 0 - -
10-20cm;-21.8%,0.58%(
00 -34
--A-- 4O-50cm;-21.4%,0.58%(
-36 ~
~
1
-6:- 65-85 cm; -22.0%, 0.65% (
--.-- 10()"'120 cm;-21.9%,0.49%(
-+-- 16()"'180 cm;-22.3%,0.61 % (
-~ r
~ ]
20()'" 220 em; -22.2%,0.56% (
--.--40 _ 1,1 ~rro: II
--A- 28()"'300 cm;-22.0%,0.56%(
28
29
30
31
32
33
34
n-alkane carbon number
Fig. 19.3. Carbon isotopic compositions of n-alkanes from sediments from the Johnstone River, North
Queensland, Australia, and a 3-m marine sediment core off the mouth of the Johnstone R. The ol3C values of bulk organic carbon are given in the legend. Redrawn from Bird et al. (1995)
427
Gofii et al. 1998). However, significantly different results may be obtained depending
on the choice of biomarker(s). For example, Prahl et al. (1994) estimated that terrigenous OC is a minor component (::;10%) in continental slope sediments on the Washington (USA) margin based on lignin phenol concentrations and l3C of bulk ~C, but a
calculation using n-alkane concentrations and l3C of bulk OC suggested a significantly
higher input (30%).
Better still is measurement of biomarker specific isotopic compositions (Hayes et al.
1990). Compound-specific isotope analyses (CSIA) are now a common tool employed
by organic geochemists. A powerful application of CSIA has been in using n-alkanes
for tracking the anthropogenically-driven shifts in vegetation, for example in northern Australia over the past 6000 years (Bird et al. 1995). European settlement of the
region in the late 19th century resulted in the replacement of the original C3 forests by
a C 4 ecosystem of grasses (and ultimately including cultivated sugarcane). The principle behind the Bird et al. analysis is that n-alkanes (1) are robust biomarkers for vascular plants, (2) are stable against diagenesis and hence well-preserved in sediments,
and (3) record the stable carbon isotope values of their C 3 (8l3C - -280/00) vs. C 4
(8 13 C - -12%0) plant sources. Figure 19.3 shows carbon isotope values for n-alkanes
in a set of sediments from the Johnstone River, North Queensland, and a marine sediment core off the mouth of the Johnstone River. Among the river sediments, the sample
from tlIe forested area (JR-8B) was the most depleted in 13C (8 13 C -27.9%0), while the
sample from a sugarcane cultivating region (JR4) was most enriched (813C -20.90/00).
-26.
Terrestrial samples
--0- JR4 «(4); -20.9%, 5.4% (
-28 ~
n
//
~ --0- Burdekin «(4); -22.3%, 0.23% (
---JR8B (C3); -27.9%,4.2% (
-30 ~ ~
'"
-/.'~ 1 Marine samples
,
-32 t
1
-.to-- 0-5 cm; -19.8%, 0.59% (
--.-- 0-9 cm;-20.6%, 0.57% (
- - 0 - -
10-20cm;-21.8%,0.58%(
00 -34
--A-- 4O-50cm;-21.4%,0.58%(
-36 ~
~
1
-6:- 65-85 cm; -22.0%, 0.65% (
--.-- 10()"'120 cm;-21.9%,0.49%(
-+-- 16()"'180 cm;-22.3%,0.61 % (
-~ r
~ ]
20()'" 220 em; -22.2%,0.56% (
--.--40 _ 1,1 ~rro: II
--A- 28()"'300 cm;-22.0%,0.56%(
28
29
30
31
32
33
34
n-alkane carbon number
Fig. 19.3. Carbon isotopic compositions of n-alkanes from sediments from the Johnstone River, North
Queensland, Australia, and a 3-m marine sediment core off the mouth of the Johnstone R. The ol3C values of bulk organic carbon are given in the legend. Redrawn from Bird et al. (1995)