

CHAPTER 15 . Toxic Effects of Organometallic Compounds towards Marine Biota
351
Table 15.9. Retention (0/0) of three arsenic compounds in individual tissues and whole shrimp fed
951lg As (normalized see Francesconi et al. 1999) over 19 days. The proportion of arsenic body burden
in each tissue is shown in parentheses. Values for midgut gland and gills are based on arsenic contents
of pooled tissues
Tissue
Me 2 As-sugar group
Me 3 As-sugar group
Arsenobetain group
Tail muscle
0.32 (0.355)
1.08 (0.258)
27.6 (0.488)
Midgut gland
0.02 (0.022)
0.40 (0.096)
2.1 (0.038)
Gills
0.03 (0.035)
0.12 (0.029)
1.1 (0.019)
Remainder a
0.53 (0.588)
2.58 (0.617)
25.7 (0.455)
Whole animal
0.9 (1.00)
4.2 (1.00)
57 (1.00)
a Not including haemolymph and other fluids lost during dissection. Values have been rounded to
two significant figures.
o
II
C1HP -OC-R 1
II
CHO -C-Rz
I
0
C~
II
I
CH 0 -P-O- CH CH -As+- CH
z
I
Z
Z
I
3
0CH 3
o
II
CH O-C- R
I
2
0
1
II
CHO-C- R2
I 0
CH3
II
I
CH20 - P-O- CH2CHOHCHP H O CH2-As = 0
I
I
0CH 3
HO
OH
Fig. 15.7. The molecular structures of phosphatidylarsenocholine and phosphatidyl arsenosugar. -OCR 1
and -OCR2: fatty acyl groups, adapted from Hanaoka et al. (1999b)
250
,
:§" 200
g.
... 1\1
8.
.!?) 150
~
t::
0
. .-:;
(!! 100
~
I
v
t::
0
v
III
3
I
Alkali-stable arsenolipid
.-J
Alkali-labile arsenolipid
4
)
1 Stomach
2 Heart
3 Liver
4 Gallbladder
5 Intestine
6 Skin
7 Dark muscle
8 Spleen
9 Bone
10 White muscle
11 Kidney
12 Brain
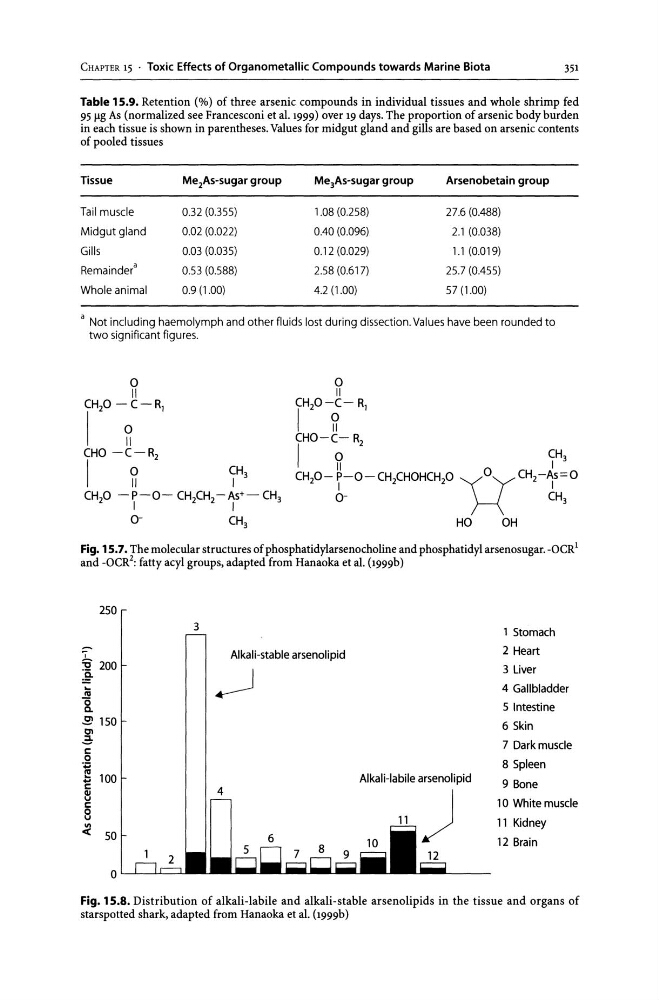
Fig. 15.8. Distribution of alkali-labile and alkali-stable arsenolipids in the tissue and organs of
starspotted shark, adapted from Hanaoka et al. (1999b)
351
Table 15.9. Retention (0/0) of three arsenic compounds in individual tissues and whole shrimp fed
951lg As (normalized see Francesconi et al. 1999) over 19 days. The proportion of arsenic body burden
in each tissue is shown in parentheses. Values for midgut gland and gills are based on arsenic contents
of pooled tissues
Tissue
Me 2 As-sugar group
Me 3 As-sugar group
Arsenobetain group
Tail muscle
0.32 (0.355)
1.08 (0.258)
27.6 (0.488)
Midgut gland
0.02 (0.022)
0.40 (0.096)
2.1 (0.038)
Gills
0.03 (0.035)
0.12 (0.029)
1.1 (0.019)
Remainder a
0.53 (0.588)
2.58 (0.617)
25.7 (0.455)
Whole animal
0.9 (1.00)
4.2 (1.00)
57 (1.00)
a Not including haemolymph and other fluids lost during dissection. Values have been rounded to
two significant figures.
o
II
C1HP -OC-R 1
II
CHO -C-Rz
I
0
C~
II
I
CH 0 -P-O- CH CH -As+- CH
z
I
Z
Z
I
3
0CH 3
o
II
CH O-C- R
I
2
0
1
II
CHO-C- R2
I 0
CH3
II
I
CH20 - P-O- CH2CHOHCHP H O CH2-As = 0
I
I
0CH 3
HO
OH
Fig. 15.7. The molecular structures of phosphatidylarsenocholine and phosphatidyl arsenosugar. -OCR 1
and -OCR2: fatty acyl groups, adapted from Hanaoka et al. (1999b)
250
,
:§" 200
g.
... 1\1
8.
.!?) 150
~
t::
0
. .-:;
(!! 100
~
I
v
t::
0
v
III
3
I
Alkali-stable arsenolipid
.-J
Alkali-labile arsenolipid
4
)
1 Stomach
2 Heart
3 Liver
4 Gallbladder
5 Intestine
6 Skin
7 Dark muscle
8 Spleen
9 Bone
10 White muscle
11 Kidney
12 Brain
Fig. 15.8. Distribution of alkali-labile and alkali-stable arsenolipids in the tissue and organs of
starspotted shark, adapted from Hanaoka et al. (1999b)