

CHAPTER 1 • Sea Water as an Electrolyte
17
(p - pO) x 1 ()6 (bar1)
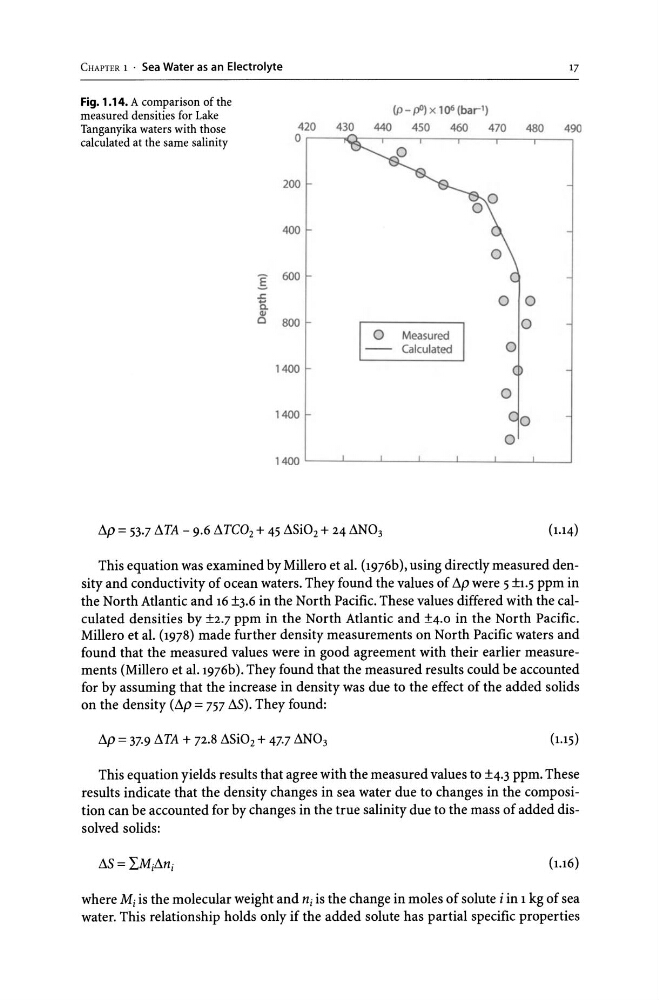
Fig. 1.14. A comparison of the
measured densities for Lake
Tanganyika waters with those
calculated at the same salinity
420
430
440
450
460
470
480
490
O.------.a.-...,---,----,--- - , - -,-------,
200
400
]:
600
.c
Q.
800
1400
1400
1400
o Measured
010
.0
Calculated
0
o
/l,.p = 53.7 /l,.TA - 9.6 /l,.TC02 + 45 /l,.Si02 + 24 /l,.N03
(1.14)
This equation was examined by Millero et al. (1976b), using directly measured density and conductivity of ocean waters. They found the values of /l,.p were 5 ±1.5 ppm in
the North Atlantic and 16 ±3.6 in the North Pacific. These values differed with the calculated densities by ±2.7 ppm in the North Atlantic and ±4.0 in the North Pacific.
Millero et al. (1978) made further density measurements on North Pacific waters and
found that the measured values were in good agreement with their earlier measurements (Millero et al.1976b). They found that the measured results could be accounted
for by assuming that the increase in density was due to the effect of the added solids
on the density (/I,.p = 757 /l,.S). They found:
/l,.p = 37.9 /l,.TA + 72.8 /l,.Si02 + 47.7 /l,.N03
(1.15)
This equation yields results that agree with the measured values to ±4.3 ppm. These
results indicate that the density changes in sea water due to changes in the composition can be accounted for by changes in the true salinity due to the mass of added dissolved solids:
/l,.S=IMi/l,.ni
(1.16)
where Mi is the molecular weight and ni is the change in moles of solute i in 1 kg of sea
water. This relationship holds only if the added solute has partial specific properties
17
(p - pO) x 1 ()6 (bar1)
Fig. 1.14. A comparison of the
measured densities for Lake
Tanganyika waters with those
calculated at the same salinity
420
430
440
450
460
470
480
490
O.------.a.-...,---,----,--- - , - -,-------,
200
400
]:
600
.c
Q.
800
1400
1400
1400
o Measured
010
.0
Calculated
0
o
/l,.p = 53.7 /l,.TA - 9.6 /l,.TC02 + 45 /l,.Si02 + 24 /l,.N03
(1.14)
This equation was examined by Millero et al. (1976b), using directly measured density and conductivity of ocean waters. They found the values of /l,.p were 5 ±1.5 ppm in
the North Atlantic and 16 ±3.6 in the North Pacific. These values differed with the calculated densities by ±2.7 ppm in the North Atlantic and ±4.0 in the North Pacific.
Millero et al. (1978) made further density measurements on North Pacific waters and
found that the measured values were in good agreement with their earlier measurements (Millero et al.1976b). They found that the measured results could be accounted
for by assuming that the increase in density was due to the effect of the added solids
on the density (/I,.p = 757 /l,.S). They found:
/l,.p = 37.9 /l,.TA + 72.8 /l,.Si02 + 47.7 /l,.N03
(1.15)
This equation yields results that agree with the measured values to ±4.3 ppm. These
results indicate that the density changes in sea water due to changes in the composition can be accounted for by changes in the true salinity due to the mass of added dissolved solids:
/l,.S=IMi/l,.ni
(1.16)
where Mi is the molecular weight and ni is the change in moles of solute i in 1 kg of sea
water. This relationship holds only if the added solute has partial specific properties