

328
V. S. Petrosyan
Usually the models evaluating transport and accumulation of POPs consider the
following compartments: air, soil, sea, vegetation and litterfall (Pekar et al. 1998). For
example, in the recent joint report (Pekar et al. 1999) of the Meteorological Synthesizing Centre-East and Norwegian Institute for Air Research, it is assumed that initially
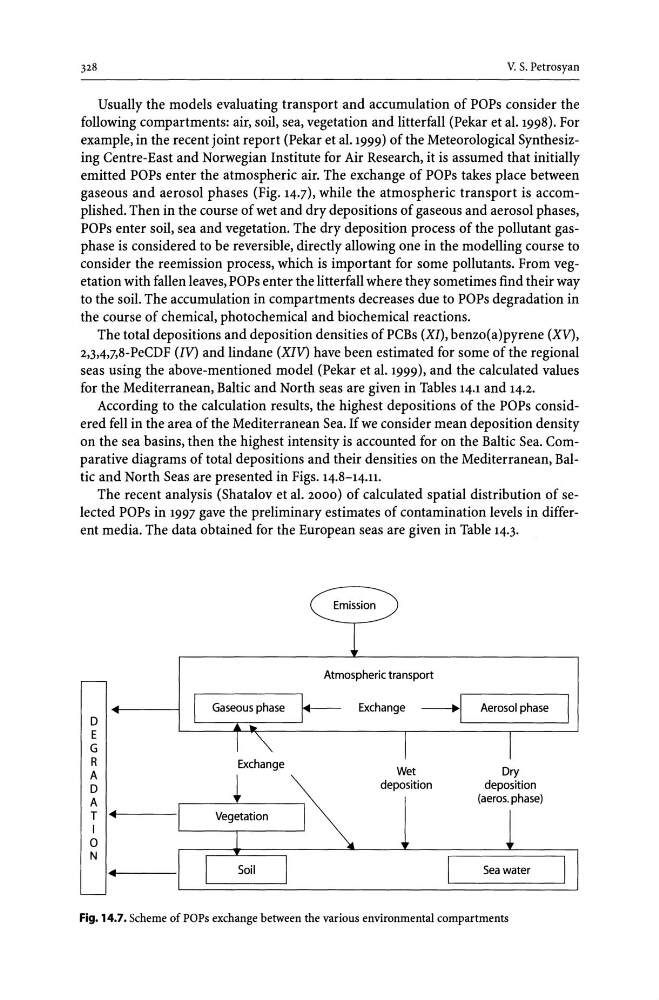
emitted POPs enter the atmospheric air. The exchange of POPs takes place between
gaseous and aerosol phases (Fig. 14.7), while the atmospheric transport is accomplished. Then in the course of wet and dry depositions of gaseous and aerosol phases,
POPs enter soil, sea and vegetation. The dry deposition process of the pollutant gasphase is considered to be reversible, directly allowing one in the modelling course to
consider the reemission process, which is important for some pollutants. From vegetation with fallen leaves, POPs enter the litterfall where they sometimes find their way
to the soil. The accumulation in compartments decreases due to POPs degradation in
the course of chemical, photochemical and biochemical reactions.
The total depositions and deposition densities of PCBs (XI), benzo(a)pyrene (XV),
2,3,4,7,8-PeCDF (IV) and lindane (XIV) have been estimated for some of the regional
seas using the above-mentioned model (Pekar et al. 1999), and the calculated values
for the Mediterranean, Baltic and North seas are given in Tables 14.1 and 14.2.
According to the calculation results, the highest depositions of the POPs considered fell in the area of the Mediterranean Sea. If we consider mean deposition density
on the sea basins, then the highest intensity is accounted for on the Baltic Sea. Comparative diagrams of total depositions and their densities on the Mediterranean, Baltic and North Seas are presented in Figs. 14.8-14.11.
The recent analysis (Shatalov et al. 2000) of calculated spatial distribution of selected POPs in 1997 gave the preliminary estimates of contamination levels in different media. The data obtained for the European seas are given in Table 14.3.
D
E
G
R
A
D
A
T I . . . . . . f - - - - -
I
o
N
....
Exchange
~
~
Atmospheric transport
Exchange ----' 1 Aerosol phase J
Wet
deposition
Dry
deposition
(aeros. phase)
Fig. 14.7. Scheme of POPs exchange between the various environmental compartments
V. S. Petrosyan
Usually the models evaluating transport and accumulation of POPs consider the
following compartments: air, soil, sea, vegetation and litterfall (Pekar et al. 1998). For
example, in the recent joint report (Pekar et al. 1999) of the Meteorological Synthesizing Centre-East and Norwegian Institute for Air Research, it is assumed that initially
emitted POPs enter the atmospheric air. The exchange of POPs takes place between
gaseous and aerosol phases (Fig. 14.7), while the atmospheric transport is accomplished. Then in the course of wet and dry depositions of gaseous and aerosol phases,
POPs enter soil, sea and vegetation. The dry deposition process of the pollutant gasphase is considered to be reversible, directly allowing one in the modelling course to
consider the reemission process, which is important for some pollutants. From vegetation with fallen leaves, POPs enter the litterfall where they sometimes find their way
to the soil. The accumulation in compartments decreases due to POPs degradation in
the course of chemical, photochemical and biochemical reactions.
The total depositions and deposition densities of PCBs (XI), benzo(a)pyrene (XV),
2,3,4,7,8-PeCDF (IV) and lindane (XIV) have been estimated for some of the regional
seas using the above-mentioned model (Pekar et al. 1999), and the calculated values
for the Mediterranean, Baltic and North seas are given in Tables 14.1 and 14.2.
According to the calculation results, the highest depositions of the POPs considered fell in the area of the Mediterranean Sea. If we consider mean deposition density
on the sea basins, then the highest intensity is accounted for on the Baltic Sea. Comparative diagrams of total depositions and their densities on the Mediterranean, Baltic and North Seas are presented in Figs. 14.8-14.11.
The recent analysis (Shatalov et al. 2000) of calculated spatial distribution of selected POPs in 1997 gave the preliminary estimates of contamination levels in different media. The data obtained for the European seas are given in Table 14.3.
D
E
G
R
A
D
A
T I . . . . . . f - - - - -
I
o
N
....
Exchange
~
~
Atmospheric transport
Exchange ----' 1 Aerosol phase J
Wet
deposition
Dry
deposition
(aeros. phase)
Fig. 14.7. Scheme of POPs exchange between the various environmental compartments