

CHAPTER 12 . Modelling of Natural Fluids: Are the Available Databases Adequate for this Purpose?
303
Table 12.1. Survey of the composition (-p,q) (see Eq.12.1) of the hydrolytic species of the lanthanides
ee 3 + Pr 3 + Nd 3 + Pm 3 + 5m 3 + Eu" Gd 3 + Tb 3 + DyH HOH ErH Tm 3 + Yb 3 + Lu 3 +
(-1,1) (-1,1) (-1,1) (-1,1) (-1,1) (-1,1) (-1,1) (-1,1) (-1,1) (-1,1) (-1,1) (-1,1) (-1,1) (-1,1)
(-2,1) (-1,2) (-2,2) (-2,1) (-2,1) (-2,1) (-2,1) (-2,1)
(-2,1)
(-2,1) (-4,1)
(-3,1) (-2,2) (-8,6)
(-2,2)
(-2,2)
(-2,2)
(-2,2) (-5,1)
(-5,3) (-3,1) (-12,6)
(-3,1)
(-3,1)
(-3,1) (-6,1)
(-4,l)
(-4,3)
(-4,1)
(-4,1)
(-5,3)
(-5,3)
(-5,1)
(-5,1)
(-6,4)
(-6,1)
(-5,3)
(-9,5)
(-6,1)
(-6,4)
4 I
I
I
,.
3
"-I
8 2
o+,--------~--------~--------_.--------_,,_------~
~%
6.05
6.20
6.35
6.50
6.65
-Iogh
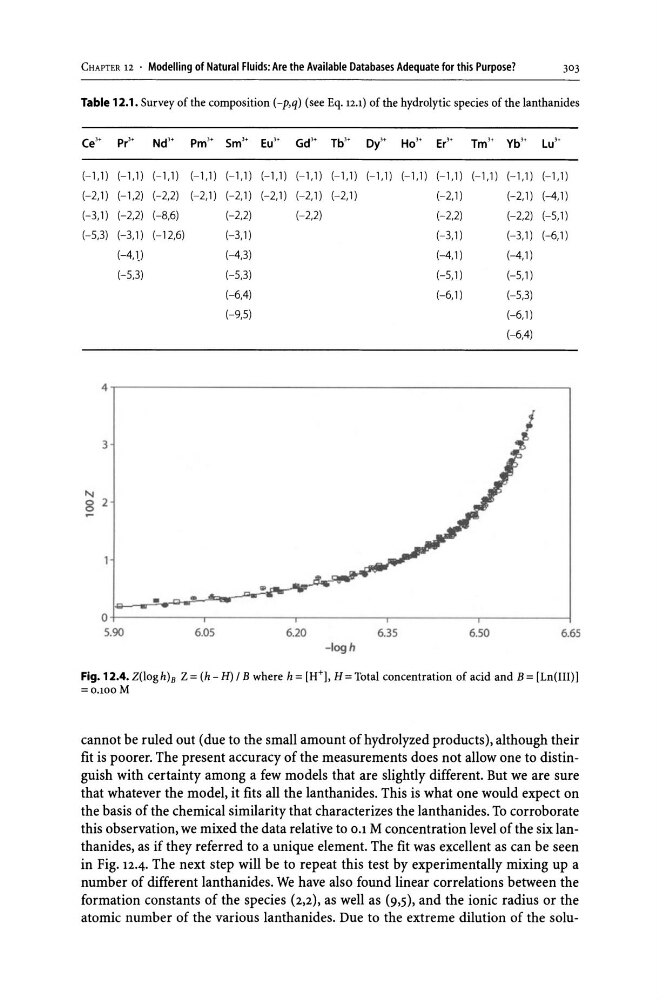
Fig. 12.4. Z(loghla Z = (h - H) I B where h = [H+], H = Total concentration of acid and B = [Ln(III)]
=0.100 M
cannot be ruled out (due to the small amount of hydrolyzed products), although their
fit is poorer. The present accuracy of the measurements does not allow one to distinguish with certainty among a few models that are slightly different. But we are sure
that whatever the model, it fits all the lanthanides. This is what one would expect on
the basis of the chemical similarity that characterizes the lanthanides. To corroborate
this observation, we mixed the data relative to 0.1 M concentration level of the six lanthanides, as if they referred to a unique element. The fit was excellent as can be seen
in Fig. 12-4- The next step will be to repeat this test by experimentally mixing up a
number of different lanthanides. We have also found linear correlations between the
formation constants of the species (2,2), as well as (9,5), and the ionic radius or the
atomic number of the various lanthanides. Due to the extreme dilution of the solu-
303
Table 12.1. Survey of the composition (-p,q) (see Eq.12.1) of the hydrolytic species of the lanthanides
ee 3 + Pr 3 + Nd 3 + Pm 3 + 5m 3 + Eu" Gd 3 + Tb 3 + DyH HOH ErH Tm 3 + Yb 3 + Lu 3 +
(-1,1) (-1,1) (-1,1) (-1,1) (-1,1) (-1,1) (-1,1) (-1,1) (-1,1) (-1,1) (-1,1) (-1,1) (-1,1) (-1,1)
(-2,1) (-1,2) (-2,2) (-2,1) (-2,1) (-2,1) (-2,1) (-2,1)
(-2,1)
(-2,1) (-4,1)
(-3,1) (-2,2) (-8,6)
(-2,2)
(-2,2)
(-2,2)
(-2,2) (-5,1)
(-5,3) (-3,1) (-12,6)
(-3,1)
(-3,1)
(-3,1) (-6,1)
(-4,l)
(-4,3)
(-4,1)
(-4,1)
(-5,3)
(-5,3)
(-5,1)
(-5,1)
(-6,4)
(-6,1)
(-5,3)
(-9,5)
(-6,1)
(-6,4)
4 I
I
I
,.
3
"-I
8 2
o+,--------~--------~--------_.--------_,,_------~
~%
6.05
6.20
6.35
6.50
6.65
-Iogh
Fig. 12.4. Z(loghla Z = (h - H) I B where h = [H+], H = Total concentration of acid and B = [Ln(III)]
=0.100 M
cannot be ruled out (due to the small amount of hydrolyzed products), although their
fit is poorer. The present accuracy of the measurements does not allow one to distinguish with certainty among a few models that are slightly different. But we are sure
that whatever the model, it fits all the lanthanides. This is what one would expect on
the basis of the chemical similarity that characterizes the lanthanides. To corroborate
this observation, we mixed the data relative to 0.1 M concentration level of the six lanthanides, as if they referred to a unique element. The fit was excellent as can be seen
in Fig. 12-4- The next step will be to repeat this test by experimentally mixing up a
number of different lanthanides. We have also found linear correlations between the
formation constants of the species (2,2), as well as (9,5), and the ionic radius or the
atomic number of the various lanthanides. Due to the extreme dilution of the solu-