

270
1. Grenthe
C~a' are tabulated quantities for each cation-anion pair (Pitzer 1991), Eeij(I) is a function of the ionic strength only; it is zero except for unsymmetrical mixing of ions of
the same sign, i.e. when the charges of i and j are of the same sign but different magnitude (this term is given by theory and its values can calculated numerically as described in (Pitzer 1991, Appendix B). g(aI I12 ) and g'(art /2 ) are known functions of I;
a is an empirical parameter equal to 2.0 kgl/2 mOrll2.
The features of the Pitzer and the SIT -models given above provide the rationale for
the simplification of the Pitzer equations presented below.
10.5
Comparison of the SIT and Pitzer Models
How many empirical parameters is it advisable to use when calculating activity factors? It is wise to keep the old scholastic principle called Occam's razor in mind. This
maxim says, "Entities are not to be multiplied without necessity:' or in Bertrand Russel's
(1959) words: "If everything in some science can be interpreted without assuming this
or that hypothetical entity, there is no ground assuming it:' In the following, we will
discuss some possible simplifications of the Pitzer model. The most common simplification is to neglect the contribution of the third virial coefficient. Indeed, a check of
the typical values of C contribution is significant only at high ionic strength, typically above 5-6 mol kg-I.
Hence, C Another simplification of the Pitzer model was proposed by Millero (1983), who
suggested the estimate [3(l) = 0, for complexes. This simplification may lead to errors
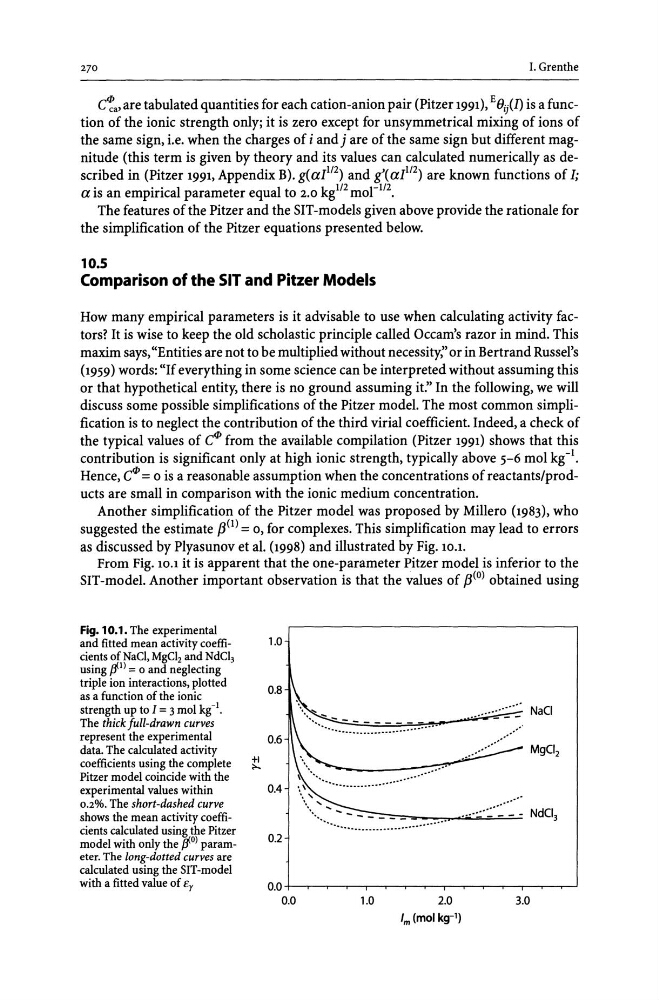
as discussed by Plyasunov et al. (1998) and illustrated by Fig. 10.1.
From Fig. 10.1 it is apparent that the one-parameter Pitzer model is inferior to the
SIT-model. Another important observation is that the values of [3(0) obtained using
Fig. 10.1. The experimental
and fitted mean activity coefficients of NaCl, MgCl2 and NdCl3
using Ifl) = 0 and neglecting
triple ion interactions, plotted
as a function of the ionic
strength up to I = 3 mol kg-I.
The thick full-drawn curves
represent the experimental
data. The calculated activity
coefficients using the complete
Pitzer model coincide with the
experimental values within
0.2%. The short-dashed curve
shows the mean activity coefficients calculated using the Pitzer
model with only the pO) parameter. The long-dotted curves are
calculated using the SIT-model
with a fitted value of Er
+1
?-.
1.0
0.8
• .•• NaCi
- - - - -~
0.6
MgCl 2
.-.0.4
NdCl 3
............
. . ~.~=-~--~-.-.----.. - - . . , - -
0.2
0.0 +I----,-r--r-,-~~----,~,-~~~___r-~~
0.0
1.0
2.0
1m (mol kg-l)
3.0
1. Grenthe
C~a' are tabulated quantities for each cation-anion pair (Pitzer 1991), Eeij(I) is a function of the ionic strength only; it is zero except for unsymmetrical mixing of ions of
the same sign, i.e. when the charges of i and j are of the same sign but different magnitude (this term is given by theory and its values can calculated numerically as described in (Pitzer 1991, Appendix B). g(aI I12 ) and g'(art /2 ) are known functions of I;
a is an empirical parameter equal to 2.0 kgl/2 mOrll2.
The features of the Pitzer and the SIT -models given above provide the rationale for
the simplification of the Pitzer equations presented below.
10.5
Comparison of the SIT and Pitzer Models
How many empirical parameters is it advisable to use when calculating activity factors? It is wise to keep the old scholastic principle called Occam's razor in mind. This
maxim says, "Entities are not to be multiplied without necessity:' or in Bertrand Russel's
(1959) words: "If everything in some science can be interpreted without assuming this
or that hypothetical entity, there is no ground assuming it:' In the following, we will
discuss some possible simplifications of the Pitzer model. The most common simplification is to neglect the contribution of the third virial coefficient. Indeed, a check of
the typical values of C contribution is significant only at high ionic strength, typically above 5-6 mol kg-I.
Hence, C Another simplification of the Pitzer model was proposed by Millero (1983), who
suggested the estimate [3(l) = 0, for complexes. This simplification may lead to errors
as discussed by Plyasunov et al. (1998) and illustrated by Fig. 10.1.
From Fig. 10.1 it is apparent that the one-parameter Pitzer model is inferior to the
SIT-model. Another important observation is that the values of [3(0) obtained using
Fig. 10.1. The experimental
and fitted mean activity coefficients of NaCl, MgCl2 and NdCl3
using Ifl) = 0 and neglecting
triple ion interactions, plotted
as a function of the ionic
strength up to I = 3 mol kg-I.
The thick full-drawn curves
represent the experimental
data. The calculated activity
coefficients using the complete
Pitzer model coincide with the
experimental values within
0.2%. The short-dashed curve
shows the mean activity coefficients calculated using the Pitzer
model with only the pO) parameter. The long-dotted curves are
calculated using the SIT-model
with a fitted value of Er
+1
?-.
1.0
0.8
• .•• NaCi
- - - - -~
0.6
MgCl 2
.-.0.4
NdCl 3
............
. . ~.~=-~--~-.-.----.. - - . . , - -
0.2
0.0 +I----,-r--r-,-~~----,~,-~~~___r-~~
0.0
1.0
2.0
1m (mol kg-l)
3.0