

CHAPTER 6 . Diagenesis of Organic Matter at the Water-Sediment Interface
157
most labile. The ratio of carbohydrate:protein metabolism decreased from 15 during
aerobic decomposition to 3 during anaerobic decomposition. These trends were interpreted as resulting from a metabolic shift in microbial community under anoxic
conditions in favour of protein metabolism over that of carbohydrates.
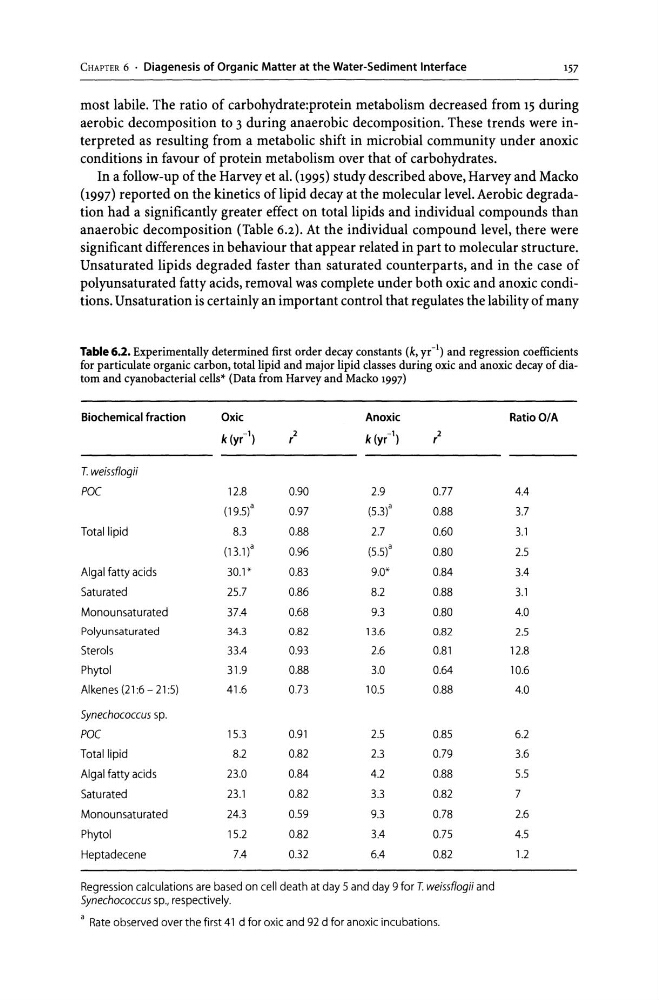
In a follow-up of the Harvey et al. (1995) study described above, Harvey and Macko
(1997) reported on the kinetics oflipid decay at the molecular level. Aerobic degradation had a significantly greater effect on total lipids and individual compounds than
anaerobic decomposition (Table 6.2). At the individual compound level, there were
significant differences in behaviour that appear related in part to molecular structure.
Unsaturated lipids degraded faster than saturated counterparts, and in the case of
polyunsaturated fatty acids, removal was complete under both oxic and anoxic conditions. Unsaturation is certainly an important control that regulates the lability of many
Table 6.2. Experimentally determined first order decay constants (k, yr- 1 ) and regression coefficients
for particulate organic carbon, total lipid and major lipid classes during oxic and anoxic decay of diatom and cyanobacterial cells* (Data from Harvey and Macko 1997)
Biochemical fraction
Oxic
Anoxic
RatioO/A
k (yr-')
2
k (yr-')
2
r
r
T. weissflogii
POC
12.8
0.90
2.9
0.77
4.4
(19.5)a
0.97
(5.3)a
0.88
3.7
Total lipid
8.3
0.88
2.7
0.60
3.1
(13.1)a
0.96
(5.5)a
0.80
2.5
Algal fatty acids
30.1*
0.83
9.0'
0.84
3.4
Saturated
25.7
0.86
8.2
0.88
3.1
Monounsaturated
37.4
0.68
9.3
0.80
4.0
Polyunsaturated
34.3
0.82
13.6
0.82
2.5
Sterols
33.4
0.93
2.6
0.81
12.8
Phytol
31.9
0.88
3.0
0.64
10.6
Alkenes (21:6 - 21 :5)
41.6
0.73
10.5
0.88
4.0
Synechococcus sp.
POC
15.3
0.91
2.5
0.85
6.2
Total lipid
8.2
0.82
2.3
0.79
3.6
Algal fatty acids
23.0
0.84
4.2
0.88
5.5
Saturated
23.1
0.82
3.3
0.82
7
Monounsaturated
24.3
0.59
9.3
0.78
2.6
Phytol
15.2
0.82
3.4
0.75
4.5
Heptadecene
7.4
0.32
6.4
0.82
1.2
Regression calculations are based on cell death at day 5 and day 9 for T. weissfiogii and
Synechococcus sp., respectively.
a Rate observed over the first 41 d for oxic and 92 d for anoxic incubations.
157
most labile. The ratio of carbohydrate:protein metabolism decreased from 15 during
aerobic decomposition to 3 during anaerobic decomposition. These trends were interpreted as resulting from a metabolic shift in microbial community under anoxic
conditions in favour of protein metabolism over that of carbohydrates.
In a follow-up of the Harvey et al. (1995) study described above, Harvey and Macko
(1997) reported on the kinetics oflipid decay at the molecular level. Aerobic degradation had a significantly greater effect on total lipids and individual compounds than
anaerobic decomposition (Table 6.2). At the individual compound level, there were
significant differences in behaviour that appear related in part to molecular structure.
Unsaturated lipids degraded faster than saturated counterparts, and in the case of
polyunsaturated fatty acids, removal was complete under both oxic and anoxic conditions. Unsaturation is certainly an important control that regulates the lability of many
Table 6.2. Experimentally determined first order decay constants (k, yr- 1 ) and regression coefficients
for particulate organic carbon, total lipid and major lipid classes during oxic and anoxic decay of diatom and cyanobacterial cells* (Data from Harvey and Macko 1997)
Biochemical fraction
Oxic
Anoxic
RatioO/A
k (yr-')
2
k (yr-')
2
r
r
T. weissflogii
POC
12.8
0.90
2.9
0.77
4.4
(19.5)a
0.97
(5.3)a
0.88
3.7
Total lipid
8.3
0.88
2.7
0.60
3.1
(13.1)a
0.96
(5.5)a
0.80
2.5
Algal fatty acids
30.1*
0.83
9.0'
0.84
3.4
Saturated
25.7
0.86
8.2
0.88
3.1
Monounsaturated
37.4
0.68
9.3
0.80
4.0
Polyunsaturated
34.3
0.82
13.6
0.82
2.5
Sterols
33.4
0.93
2.6
0.81
12.8
Phytol
31.9
0.88
3.0
0.64
10.6
Alkenes (21:6 - 21 :5)
41.6
0.73
10.5
0.88
4.0
Synechococcus sp.
POC
15.3
0.91
2.5
0.85
6.2
Total lipid
8.2
0.82
2.3
0.79
3.6
Algal fatty acids
23.0
0.84
4.2
0.88
5.5
Saturated
23.1
0.82
3.3
0.82
7
Monounsaturated
24.3
0.59
9.3
0.78
2.6
Phytol
15.2
0.82
3.4
0.75
4.5
Heptadecene
7.4
0.32
6.4
0.82
1.2
Regression calculations are based on cell death at day 5 and day 9 for T. weissfiogii and
Synechococcus sp., respectively.
a Rate observed over the first 41 d for oxic and 92 d for anoxic incubations.