

CHAPTER 6 . Diagenesis of Organic Matter at the Water-Sediment Interface
153
%OC
o 0.2
o
2
E 3
..:!.
a
~ 4
5
6
7
0,
%OC
o 0.2 0.4
Olf - - - -
0.
3
4
5
6
7
%OC
o 0.2 0.4
0ir- _ . . 1 o
Of
2
2
3
3
4
4
5
5
6
6
7
7
o
Total%OC
0.2
0.4
0.6
0.8
1.0
>52
I
! I
I I
I I
I
I
1/2
o Zo,
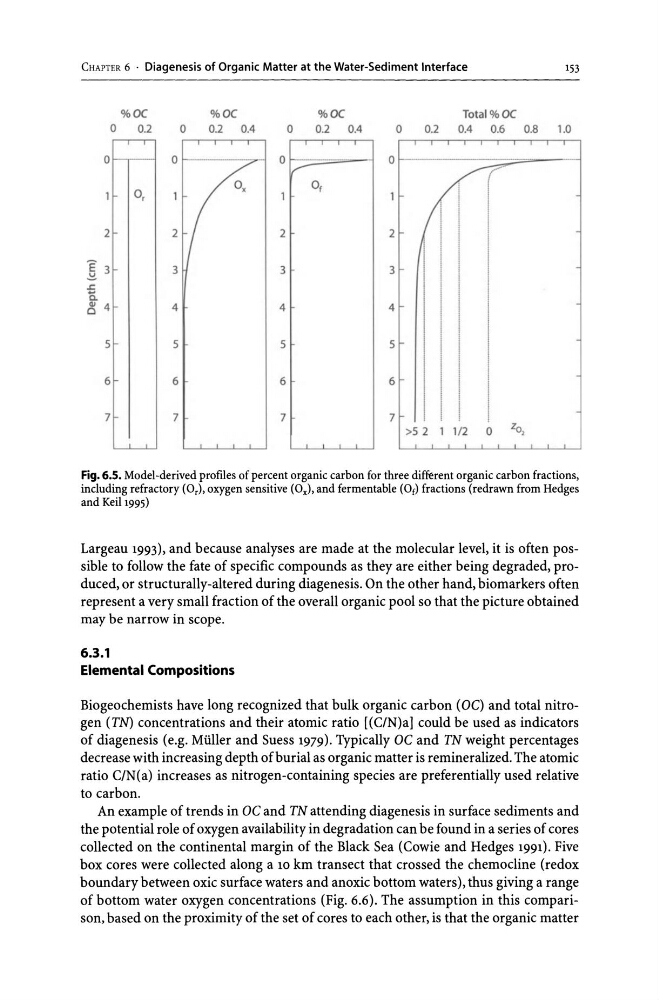
Fig. 6.5. Model-derived profiles of percent organic carbon for three different organic carbon fractions,
including refractory (0,), oxygen sensitive (Ox), and fermentable (Of) fractions (redrawn from Hedges
and Kei11995)
Largeau 1993), and because analyses are made at the molecular level, it is often possible to follow the fate of specific compounds as they are either being degraded, produced, or structurally-altered during diagenesis. On the other hand, biomarkers often
represent a very small fraction of the overall organic pool so that the picture obtained
may be narrow in scope.
6.3.1
Elemental Compositions
Biogeochemists have long recognized that bulk organic carbon (OC) and total nitrogen (TN) concentrations and their atomic ratio [(CIN)a] could be used as indicators
of diagenesis (e.g. Muller and Suess 1979). Typically OC and TN weight percentages
decrease with increasing depth of burial as organic matter is remineralized. The atomic
ratio C/N(a) increases as nitrogen-containing species are preferentially used relative
to carbon.
An example of trends in OC and TN attending diagenesis in surface sediments and
the potential role of oxygen availability in degradation can be found in a series of cores
collected on the continental margin of the Black Sea (Cowie and Hedges 1991). Five
box cores were collected along a 10 km transect that crossed the chemocline (redox
boundary between oxic surface waters and anoxic bottom waters), thus giving a range
of bottom water oxygen concentrations (Fig. 6.6). The assumption in this comparison, based on the proximity of the set of cores to each other, is that the organic matter
153
%OC
o 0.2
o
2
E 3
..:!.
a
~ 4
5
6
7
0,
%OC
o 0.2 0.4
Olf - - - -
0.
3
4
5
6
7
%OC
o 0.2 0.4
0ir- _ . . 1 o
Of
2
2
3
3
4
4
5
5
6
6
7
7
o
Total%OC
0.2
0.4
0.6
0.8
1.0
>52
I
! I
I I
I I
I
I
1/2
o Zo,
Fig. 6.5. Model-derived profiles of percent organic carbon for three different organic carbon fractions,
including refractory (0,), oxygen sensitive (Ox), and fermentable (Of) fractions (redrawn from Hedges
and Kei11995)
Largeau 1993), and because analyses are made at the molecular level, it is often possible to follow the fate of specific compounds as they are either being degraded, produced, or structurally-altered during diagenesis. On the other hand, biomarkers often
represent a very small fraction of the overall organic pool so that the picture obtained
may be narrow in scope.
6.3.1
Elemental Compositions
Biogeochemists have long recognized that bulk organic carbon (OC) and total nitrogen (TN) concentrations and their atomic ratio [(CIN)a] could be used as indicators
of diagenesis (e.g. Muller and Suess 1979). Typically OC and TN weight percentages
decrease with increasing depth of burial as organic matter is remineralized. The atomic
ratio C/N(a) increases as nitrogen-containing species are preferentially used relative
to carbon.
An example of trends in OC and TN attending diagenesis in surface sediments and
the potential role of oxygen availability in degradation can be found in a series of cores
collected on the continental margin of the Black Sea (Cowie and Hedges 1991). Five
box cores were collected along a 10 km transect that crossed the chemocline (redox
boundary between oxic surface waters and anoxic bottom waters), thus giving a range
of bottom water oxygen concentrations (Fig. 6.6). The assumption in this comparison, based on the proximity of the set of cores to each other, is that the organic matter