

CHAPTER 4 . Sedimentary Organic Matter Preservation and Atmospheric O2 Regulation
115
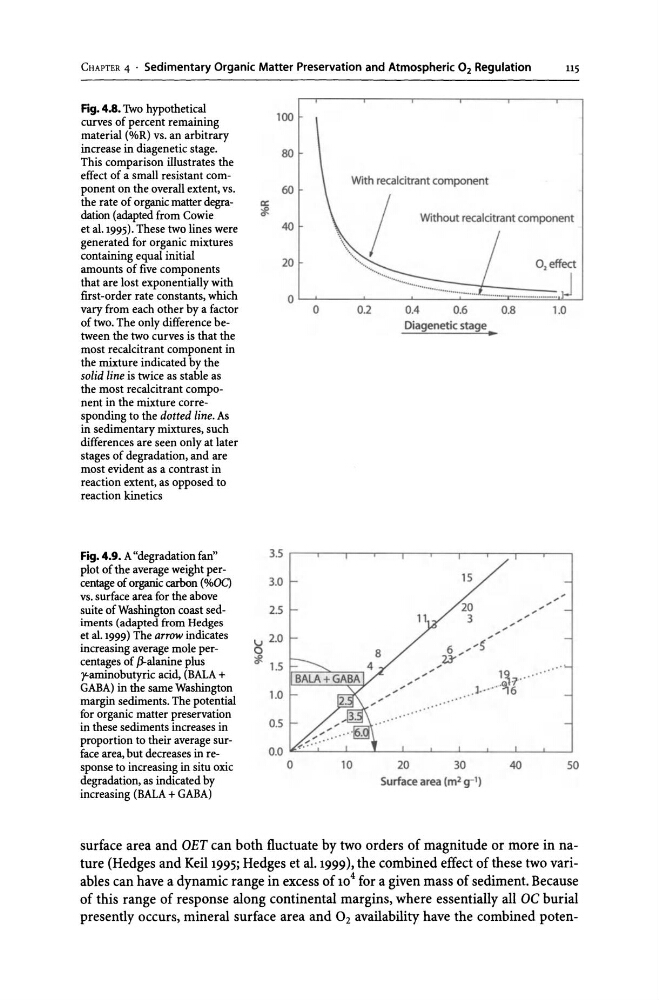
Fig. 4.8. Two hypothetical
curves of percent remaining
material (O/OR) vs. an arbitrary
increase in diagenetic stage.
This comparison illustrates the
effect of a small resistant component on the overall extent, vs.
the rate of organic matter degradation (adapted from Cowie
et al. 1995). These two lines were
generated for organic mixtures
containing equal initial
amounts of five components
that are lost exponentially with
fust -order rate constants, which
vary from each other by a factor
of two. The only difference between the two curves is that the
most recalcitrant component in
the mixture indicated by the
solid line is twice as stable as
the most recalcitrant component in the mixture corresponding to the dotted line. As
in sedimentary mixtures, such
differences are seen only at later
stages of degradation, and are
most evident as a contrast in
reaction extent, as opposed to
reaction kinetics
Fig. 4.9. A "degradation fan"
plot of the average weight percentage of organic carbon (%OC)
vs. surface area for the above
suite of Washington coast sediments (adapted from Hedges
et al. 1999) The arrow indicates
increasing average mole percentages of J3-alanine plus
?,"antinobutyric acid, (BALA +
GABA) in the same Washington
margin sediments. The potential
for organic matter preservation
in these sediments increases in
proportion to their average surface area, but decreases in response to increasing in situ oxic
degradation, as indicated by
increasing (BALA + GABA)
100
80
60
With recalcitra nt component
c:
#40
Without recalcitrant component
20
0 '
......... ;.......
.. ....................... -
a
0.2
0.4
0.6
0.8
1.0
Diagenetic stage.
3.5 r---r-"'T""'---,r---,-..,..--,--,--,--------,---,
3.0
2.5
~ 2.0
#- 1.5 F.
......
......... . _ .........
1.0
0.5
10
11
l S
20
3
6 ........ ~..,
23'/
~
~
~
~
~
~
~
" . . . . "....
'3· 7·······
~
.].·· ·· -9)6
20
30
40
Surface area (m2 g-l)
50
surface area and OET can both fluctuate by two orders of magnitude or more in nature (Hedges and Keil1995; Hedges et al. 1999), the combined effect of these two variables can have a dynamic range in excess of 10 4 for a given mass of sediment. Because
of this range of response along continental margins, where essentially all OC burial
presently occurs, mineral surface area and O2 availability have the combined poten-
115
Fig. 4.8. Two hypothetical
curves of percent remaining
material (O/OR) vs. an arbitrary
increase in diagenetic stage.
This comparison illustrates the
effect of a small resistant component on the overall extent, vs.
the rate of organic matter degradation (adapted from Cowie
et al. 1995). These two lines were
generated for organic mixtures
containing equal initial
amounts of five components
that are lost exponentially with
fust -order rate constants, which
vary from each other by a factor
of two. The only difference between the two curves is that the
most recalcitrant component in
the mixture indicated by the
solid line is twice as stable as
the most recalcitrant component in the mixture corresponding to the dotted line. As
in sedimentary mixtures, such
differences are seen only at later
stages of degradation, and are
most evident as a contrast in
reaction extent, as opposed to
reaction kinetics
Fig. 4.9. A "degradation fan"
plot of the average weight percentage of organic carbon (%OC)
vs. surface area for the above
suite of Washington coast sediments (adapted from Hedges
et al. 1999) The arrow indicates
increasing average mole percentages of J3-alanine plus
?,"antinobutyric acid, (BALA +
GABA) in the same Washington
margin sediments. The potential
for organic matter preservation
in these sediments increases in
proportion to their average surface area, but decreases in response to increasing in situ oxic
degradation, as indicated by
increasing (BALA + GABA)
100
80
60
With recalcitra nt component
c:
#40
Without recalcitrant component
20
0 '
......... ;.......
.. ....................... -
a
0.2
0.4
0.6
0.8
1.0
Diagenetic stage.
3.5 r---r-"'T""'---,r---,-..,..--,--,--,--------,---,
3.0
2.5
~ 2.0
#- 1.5 F.
......
......... . _ .........
1.0
0.5
10
11
l S
20
3
6 ........ ~..,
23'/
~
~
~
~
~
~
~
" . . . . "....
'3· 7·······
~
.].·· ·· -9)6
20
30
40
Surface area (m2 g-l)
50
surface area and OET can both fluctuate by two orders of magnitude or more in nature (Hedges and Keil1995; Hedges et al. 1999), the combined effect of these two variables can have a dynamic range in excess of 10 4 for a given mass of sediment. Because
of this range of response along continental margins, where essentially all OC burial
presently occurs, mineral surface area and O2 availability have the combined poten-