

12.5 bee-Surface Flows
395
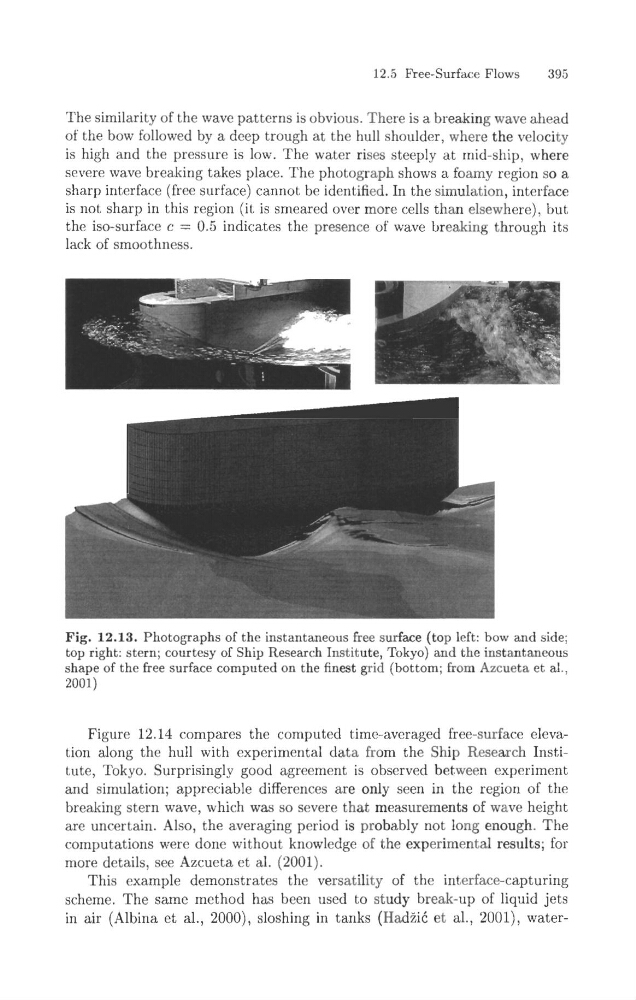
The similarity of the wave patterns is obvious. There is a breaking wave ahead
of the bow followed by a deep trough at the hull shoulder, where the velocity
is high and the pressure is low. The water rises steeply at mid-ship, where
severe wave breaking takes place. The photograph shows a foamy region so a
sharp interface (free surface) cannot be identified. In the simulation, interface
is not sharp in this region (it is smeared over more cells than elsewhere), but
the iso-surface c = 0.5 indicates the presence of wave breaking through its
lack of smoothness.
!
Fig. 12.13. Photographs of the instantaneous free surface (top left: bow and side;
top right: stern; courtesy of Ship Research Institute, Tokyo) and the instantaneous
shape of the free surface computed on the finest grid (bottom; from Azcueta et al.,
2001)
Figure 12.14 compares the computed the-averaged free-surface elevation along the hull with experimental data from the Ship Research Institute, Tokyo. Surprisingly good agreement is observed bet,ween experiment
and simulation; appreciable differences are only seen in the region of the
breaking stern wave, which was so severe that measurements of wave height
are uncertain. Also, the averaging period is probably not long enough. The
computations were done without knowledge of the experimental results; for
more details, see Azcueta et al. (2001).
This example demonstrates the versatility of the interface-capturing
scheme. The same method has been used to study break-up of liquid jets
in air (Albina et al., 2000), sloshing in tanks (HadEiC et al., 2001), water-
395
The similarity of the wave patterns is obvious. There is a breaking wave ahead
of the bow followed by a deep trough at the hull shoulder, where the velocity
is high and the pressure is low. The water rises steeply at mid-ship, where
severe wave breaking takes place. The photograph shows a foamy region so a
sharp interface (free surface) cannot be identified. In the simulation, interface
is not sharp in this region (it is smeared over more cells than elsewhere), but
the iso-surface c = 0.5 indicates the presence of wave breaking through its
lack of smoothness.
!
Fig. 12.13. Photographs of the instantaneous free surface (top left: bow and side;
top right: stern; courtesy of Ship Research Institute, Tokyo) and the instantaneous
shape of the free surface computed on the finest grid (bottom; from Azcueta et al.,
2001)
Figure 12.14 compares the computed the-averaged free-surface elevation along the hull with experimental data from the Ship Research Institute, Tokyo. Surprisingly good agreement is observed bet,ween experiment
and simulation; appreciable differences are only seen in the region of the
breaking stern wave, which was so severe that measurements of wave height
are uncertain. Also, the averaging period is probably not long enough. The
computations were done without knowledge of the experimental results; for
more details, see Azcueta et al. (2001).
This example demonstrates the versatility of the interface-capturing
scheme. The same method has been used to study break-up of liquid jets
in air (Albina et al., 2000), sloshing in tanks (HadEiC et al., 2001), water-