

462
15 Vertical Structure of Ocean Waters and Biological Productivity
a
o
C (mg·m· 3 )
p
2 3 4 5
b
10
10
20
20
o
C (mg·m· 3 )
p
2 3 4 5
30
30 -h-rf-rrr"...,rrrrrrn-rrT1
0.00 0.050.10 0.150.200.25
0.05 0.l0 0.l5 0.20 0.25
'\ (f.1mol·m· 3 )
C n (f.1 mol·m- 3 )
I I I I I I I I I I I I I I I
2 4 6 8 lO 12 14 16
T(°C)
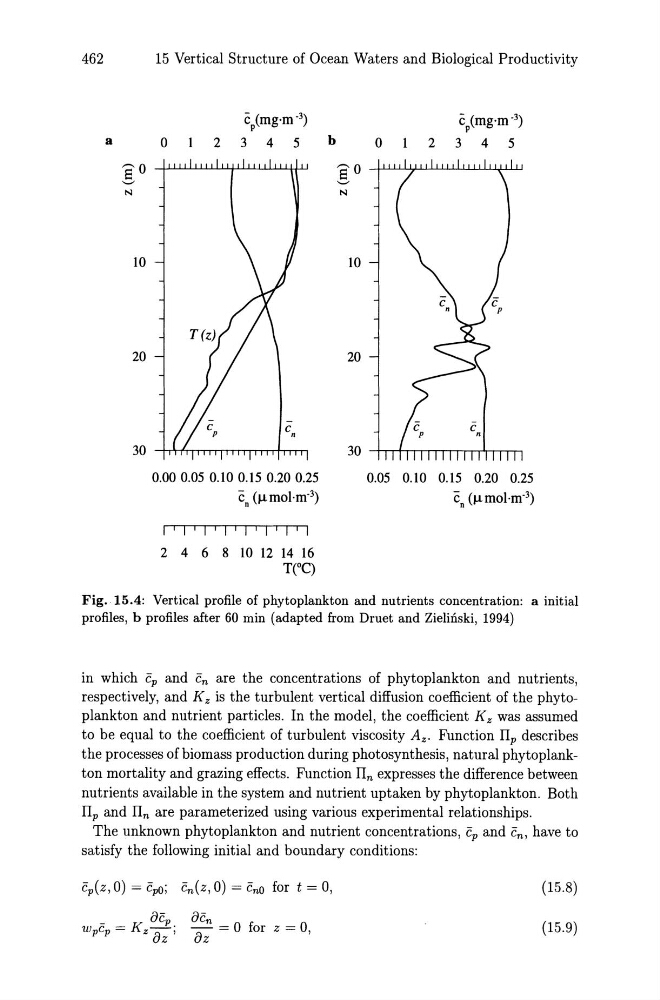
Fig. 15.4: Vertical profile of phytoplankton and nutrients concentration: a initial
profiles, b profiles after 60 min (adapted from Druet and Zielinski, 1994)
in which cp and cn are the concentrations of phytoplankton and nutrients,
respectively, and K z is the turbulent vertical diffusion coefficient of the phytoplankton and nutrient particles. In the model, the coefficient Kz was assumed
to be equal to the coefficient of turbulent viscosity Az . Function IIp describes
the processes of biomass production during photosynthesis, natural phytoplankton mortality and grazing effects. Function lIn expresses the difference between
nutrients available in the system and nutrient uptaken by phytoplankton. Both
IIp and lIn are parameterized using various experimental relationships.
The unknown phytoplankton and nutrient concentrations, cp and cn, have to
satisfy the following initial and boundary conditions:
UCn
- = 0 for z = 0,
uz
(15.8)
(15.9)
15 Vertical Structure of Ocean Waters and Biological Productivity
a
o
C (mg·m· 3 )
p
2 3 4 5
b
10
10
20
20
o
C (mg·m· 3 )
p
2 3 4 5
30
30 -h-rf-rrr"...,rrrrrrn-rrT1
0.00 0.050.10 0.150.200.25
0.05 0.l0 0.l5 0.20 0.25
'\ (f.1mol·m· 3 )
C n (f.1 mol·m- 3 )
I I I I I I I I I I I I I I I
2 4 6 8 lO 12 14 16
T(°C)
Fig. 15.4: Vertical profile of phytoplankton and nutrients concentration: a initial
profiles, b profiles after 60 min (adapted from Druet and Zielinski, 1994)
in which cp and cn are the concentrations of phytoplankton and nutrients,
respectively, and K z is the turbulent vertical diffusion coefficient of the phytoplankton and nutrient particles. In the model, the coefficient Kz was assumed
to be equal to the coefficient of turbulent viscosity Az . Function IIp describes
the processes of biomass production during photosynthesis, natural phytoplankton mortality and grazing effects. Function lIn expresses the difference between
nutrients available in the system and nutrient uptaken by phytoplankton. Both
IIp and lIn are parameterized using various experimental relationships.
The unknown phytoplankton and nutrient concentrations, cp and cn, have to
satisfy the following initial and boundary conditions:
UCn
- = 0 for z = 0,
uz
(15.8)
(15.9)