

458
15 Vertical Structure of Ocean Waters and Biological Productivity
surface
10
)
20
30
o
2
3
4
5
6
7
8
Chlorophyll concentration (mg ffi"3)
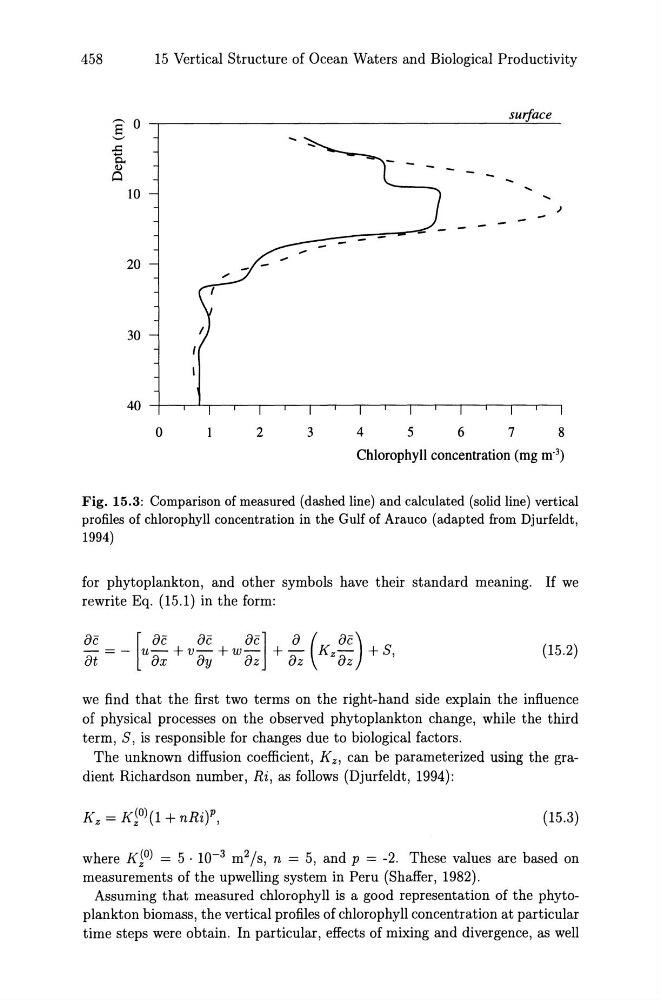
Fig. 15.3: Comparison of measured (dashed line) and calculated (solid line) vertical
profiles of chlorophyll concentration in the Gulf of Arauco (adapted from Djurfeldt,
1994)
for phytoplankton, and other symbols have their standard meaning. If we
rewrite Eq. (15.1) in the form:
- = - u- + v - + w- + - K z - + 5,
ac
[ac ac ac] a ( ac)
at
ax ay az az az
(15.2)
we find that the first two terms on the right-hand side explain the influence
of physical processes on the observed phytoplankton change, while the third
term, 5, is responsible for changes due to biological factors.
The unknown diffusion coefficient, K z , can be parameterized using the gradient Richardson number, Ri, as follows (Djurfeldt, 1994):
(15.3)
where K~O) = 5 . 10- 3 m 2 /s, n = 5, and p = -2. These values are based on
measurements of the upwelling system in Peru (Shaffer, 1982).
Assuming that measured chlorophyll is a good representation of the phytoplankton biomass, the vertical profiles of chlorophyll concentration at particular
time steps were obtain. In particular, effects of mixing and divergence, as well
15 Vertical Structure of Ocean Waters and Biological Productivity
surface
10
)
20
30
o
2
3
4
5
6
7
8
Chlorophyll concentration (mg ffi"3)
Fig. 15.3: Comparison of measured (dashed line) and calculated (solid line) vertical
profiles of chlorophyll concentration in the Gulf of Arauco (adapted from Djurfeldt,
1994)
for phytoplankton, and other symbols have their standard meaning. If we
rewrite Eq. (15.1) in the form:
- = - u- + v - + w- + - K z - + 5,
ac
[ac ac ac] a ( ac)
at
ax ay az az az
(15.2)
we find that the first two terms on the right-hand side explain the influence
of physical processes on the observed phytoplankton change, while the third
term, 5, is responsible for changes due to biological factors.
The unknown diffusion coefficient, K z , can be parameterized using the gradient Richardson number, Ri, as follows (Djurfeldt, 1994):
(15.3)
where K~O) = 5 . 10- 3 m 2 /s, n = 5, and p = -2. These values are based on
measurements of the upwelling system in Peru (Shaffer, 1982).
Assuming that measured chlorophyll is a good representation of the phytoplankton biomass, the vertical profiles of chlorophyll concentration at particular
time steps were obtain. In particular, effects of mixing and divergence, as well