

394
a
-C 100
Of)
8 80
'-'
\:I
0
'.;:::i
60
o:l
.tl
\:I
Q)
40
u
\:I
0
u 20
b -C 100
Of)
8 80
'-'
\:I
0
.~
60
.tl
\:I
Q)
40
u
\:I
0
u 20
,
" - 5
....
,/
5
13 Transport and Mixing in Coastal Ecosystems
J
20
20
I
I
Hours
I
,
Hours
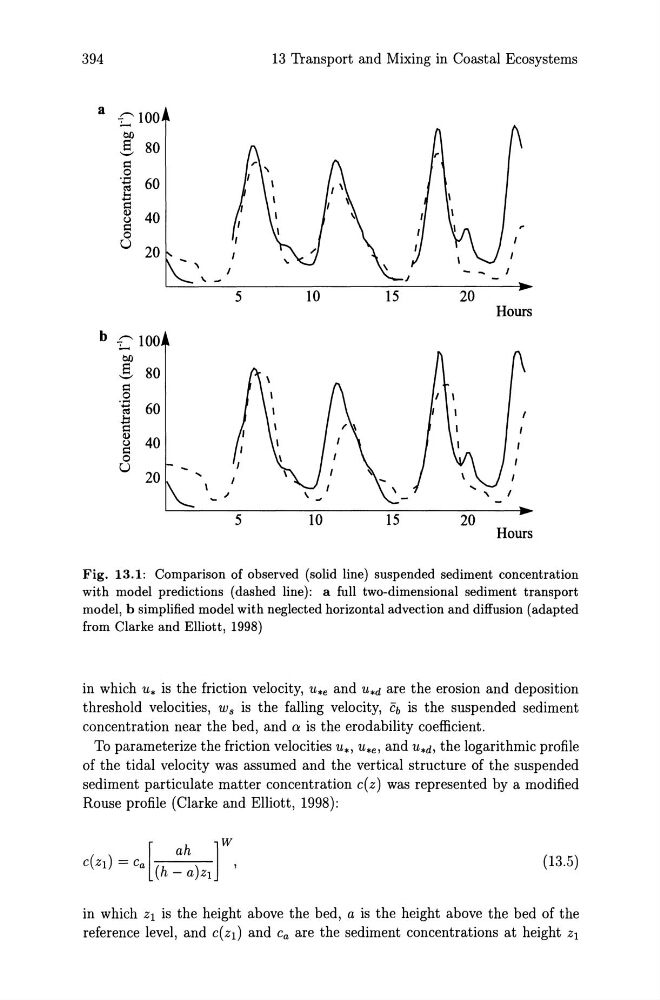
Fig. 13.1: Comparison of observed (solid line) suspended sediment concentration
with model predictions (dashed line): a full two-dimensional sediment transport
model, b simplified model with neglected horizontal advection and diffusion (adapted
from Clarke and Elliott, 1998)
in which u* is the friction velocity, U*e and U*d are the erosion and deposition
threshold velocities, w s is the falling velocity, Cb is the suspended sediment
concentration near the bed, and 0: is the erodability coefficient.
To parameterize the friction velocities U*' U*e, and U*d, the logarithmic profile
of the tidal velocity was assumed and the vertical structure of the suspended
sediment particulate matter concentration c(z) was represented by a modified
Rouse profile (Clarke and Elliott, 1998):
[
ah
]W
C(Zl) = C a (h _ a)zl '
(13.5)
in which Zl is the height above the bed, a is the height above the bed of the
reference level, and C(Zl) and Ca are the sediment concentrations at height Zl
a
-C 100
Of)
8 80
'-'
\:I
0
'.;:::i
60
o:l
.tl
\:I
Q)
40
u
\:I
0
u 20
b -C 100
Of)
8 80
'-'
\:I
0
.~
60
.tl
\:I
Q)
40
u
\:I
0
u 20
,
" - 5
....
,/
5
13 Transport and Mixing in Coastal Ecosystems
J
20
20
I
I
Hours
I
,
Hours
Fig. 13.1: Comparison of observed (solid line) suspended sediment concentration
with model predictions (dashed line): a full two-dimensional sediment transport
model, b simplified model with neglected horizontal advection and diffusion (adapted
from Clarke and Elliott, 1998)
in which u* is the friction velocity, U*e and U*d are the erosion and deposition
threshold velocities, w s is the falling velocity, Cb is the suspended sediment
concentration near the bed, and 0: is the erodability coefficient.
To parameterize the friction velocities U*' U*e, and U*d, the logarithmic profile
of the tidal velocity was assumed and the vertical structure of the suspended
sediment particulate matter concentration c(z) was represented by a modified
Rouse profile (Clarke and Elliott, 1998):
[
ah
]W
C(Zl) = C a (h _ a)zl '
(13.5)
in which Zl is the height above the bed, a is the height above the bed of the
reference level, and C(Zl) and Ca are the sediment concentrations at height Zl