

13.2 Transport and Mixing in Estuaries
393
and Thorn (1978). A similar increase in sediment transport in the Tay Estuary, Scotland, was reported by Weir and McManus (1987). The turbulence and
suspension capacity were particularly intensive during flood tides and opposing
currents and wind.
Lindsay et al. (1996), using current meters and transmissometers, moored
for 11 weeks, examined the influence of tidal range and river discharge on
suspended particulate matter fluxes in the Forth Estuary, Scotland. On the
semi-diurnal scale, suspended sediment concentration was closely related to
current velocities. In the near bottom layer, the current velocity required for
resuspension and deposition were 0.60 and 0.30 mis, respectively. The dominant suspended sediment type was mud with a median particle diameter of
less than 10 /.Lm. However, there is also some evidence of particles with diameters of greater than 250 /.Lm in the deeper channels. The data from the
transmissmeters showed that during a flood tide, with a tidal range of 5.3 m,
the concentration reaches 300 mg/I.
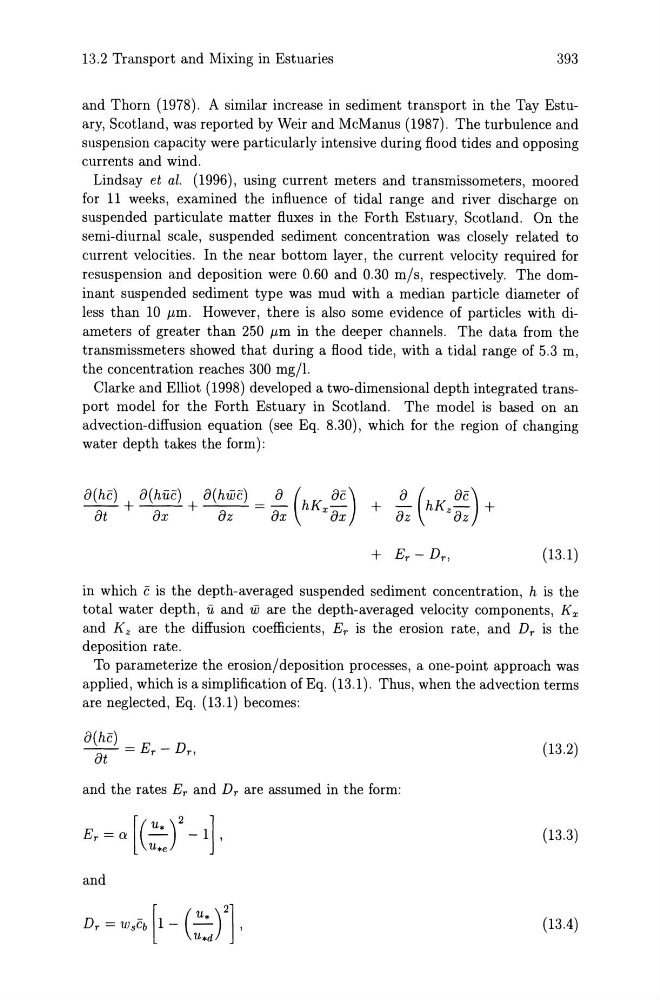
Clarke and Elliot (1998) developed a two-dimensional depth integrated transport model for the Forth Estuary in Scotland. The model is based on an
advection-diffusion equation (see Eq. 8.30), which for the region of changing
water depth takes the form):
--+---+---=- hKx -
+ - hKz "!:" +
o(hc) o(huc) o(hwc)
a (
oc)
a (
0-)
at
ax
oz
ax
ax
oz
oz
(13.1 )
in which c is the depth-averaged suspended sediment concentration, h is the
total water depth, U and ware the depth-averaged velocity components, Kx
and K z are the diffusion coefficients, Er is the erosion rate, and Dr is the
deposition rate.
To parameterize the erosion/deposition processes, a one-point approach was
applied, which is a simplification of Eq. (13.1). Thus, when the advection terms
are neglected, Eq. (13.1) becomes:
o(hc) _ E - D
at - r
r,
(13.2)
and the rates Er and Dr are assumed in the form:
(13.3)
and
(13.4)
393
and Thorn (1978). A similar increase in sediment transport in the Tay Estuary, Scotland, was reported by Weir and McManus (1987). The turbulence and
suspension capacity were particularly intensive during flood tides and opposing
currents and wind.
Lindsay et al. (1996), using current meters and transmissometers, moored
for 11 weeks, examined the influence of tidal range and river discharge on
suspended particulate matter fluxes in the Forth Estuary, Scotland. On the
semi-diurnal scale, suspended sediment concentration was closely related to
current velocities. In the near bottom layer, the current velocity required for
resuspension and deposition were 0.60 and 0.30 mis, respectively. The dominant suspended sediment type was mud with a median particle diameter of
less than 10 /.Lm. However, there is also some evidence of particles with diameters of greater than 250 /.Lm in the deeper channels. The data from the
transmissmeters showed that during a flood tide, with a tidal range of 5.3 m,
the concentration reaches 300 mg/I.
Clarke and Elliot (1998) developed a two-dimensional depth integrated transport model for the Forth Estuary in Scotland. The model is based on an
advection-diffusion equation (see Eq. 8.30), which for the region of changing
water depth takes the form):
--+---+---=- hKx -
+ - hKz "!:" +
o(hc) o(huc) o(hwc)
a (
oc)
a (
0-)
at
ax
oz
ax
ax
oz
oz
(13.1 )
in which c is the depth-averaged suspended sediment concentration, h is the
total water depth, U and ware the depth-averaged velocity components, Kx
and K z are the diffusion coefficients, Er is the erosion rate, and Dr is the
deposition rate.
To parameterize the erosion/deposition processes, a one-point approach was
applied, which is a simplification of Eq. (13.1). Thus, when the advection terms
are neglected, Eq. (13.1) becomes:
o(hc) _ E - D
at - r
r,
(13.2)
and the rates Er and Dr are assumed in the form:
(13.3)
and
(13.4)