

246
7 Ocean Currents
. .
nearshore zone
••
I
swash:
I
breaker
I
offshore
I
surJzone
I
I
I
I
zone I
zone
zone
: ...
.: ..
.: ..
.: ..
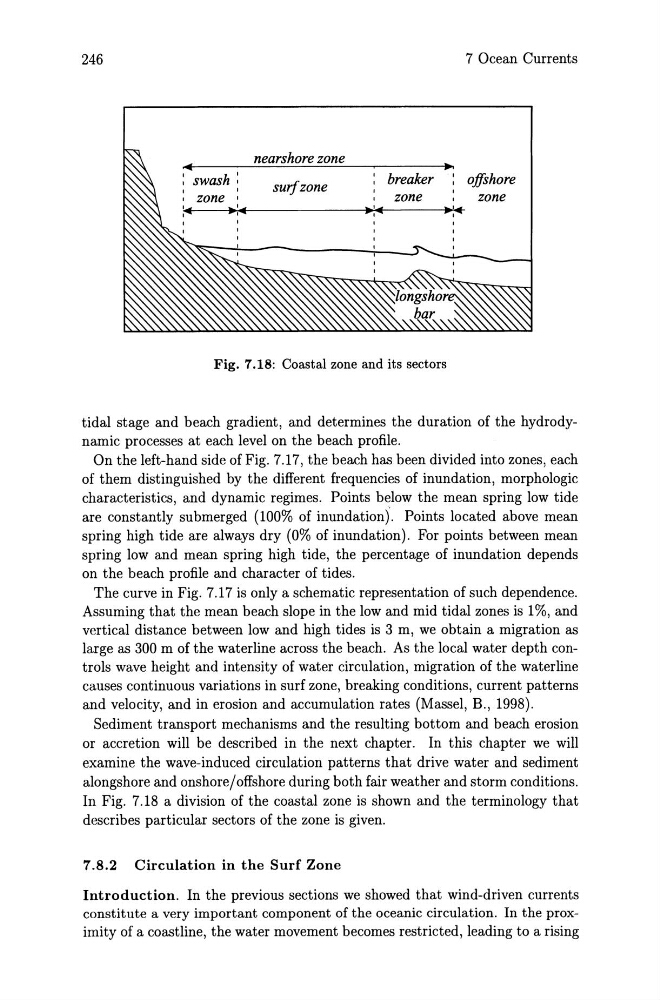
Fig. 7.18: Coastal zone and its sectors
tidal stage and beach gradient, and determines the duration of the hydrodynamic processes at each level on the beach profile.
On the left-hand side of Fig. 7.17, the beach has been divided into zones, each
of them distinguished by the different frequencies of inundation, morphologic
characteristics, and dynamic regimes. Points below the mean spring low tide
are constantly submerged (100% of inundation). Points located above mean
spring high tide are always dry (0% of inundation). For points between mean
spring low and mean spring high tide, the percentage of inundation depends
on the beach profile and character of tides.
The curve in Fig. 7.17 is only a schematic representation of such dependence.
Assuming that the mean beach slope in the low and mid tidal zones is 1%, and
vertical distance between low and high tides is 3 m, we obtain a migration as
large as 300 m of the waterline across the beach. As the local water depth controls wave height and intensity of water circulation, migration of the waterline
causes continuous variations in surf zone, breaking conditions, current patterns
and velocity, and in erosion and accumulation rates (Massel, B., 1998).
Sediment transport mechanisms and the resulting bottom and beach erosion
or accretion will be described in the next chapter. In this chapter we will
examine the wave-induced circulation patterns that drive water and sediment
alongshore and onshore/offshore during both fair weather and storm conditions.
In Fig. 7.18 a division of the coastal zone is shown and the terminology that
describes particular sectors of the zone is given.
7.8.2 Circulation in the Surf Zone
Introduction. In the previous sections we showed that wind-driven currents
constitute a very important component of the oceanic circulation. In the proximity of a coastline, the water movement becomes restricted, leading to a rising
7 Ocean Currents
. .
nearshore zone
••
I
swash:
I
breaker
I
offshore
I
surJzone
I
I
I
I
zone I
zone
zone
: ...
.: ..
.: ..
.: ..
Fig. 7.18: Coastal zone and its sectors
tidal stage and beach gradient, and determines the duration of the hydrodynamic processes at each level on the beach profile.
On the left-hand side of Fig. 7.17, the beach has been divided into zones, each
of them distinguished by the different frequencies of inundation, morphologic
characteristics, and dynamic regimes. Points below the mean spring low tide
are constantly submerged (100% of inundation). Points located above mean
spring high tide are always dry (0% of inundation). For points between mean
spring low and mean spring high tide, the percentage of inundation depends
on the beach profile and character of tides.
The curve in Fig. 7.17 is only a schematic representation of such dependence.
Assuming that the mean beach slope in the low and mid tidal zones is 1%, and
vertical distance between low and high tides is 3 m, we obtain a migration as
large as 300 m of the waterline across the beach. As the local water depth controls wave height and intensity of water circulation, migration of the waterline
causes continuous variations in surf zone, breaking conditions, current patterns
and velocity, and in erosion and accumulation rates (Massel, B., 1998).
Sediment transport mechanisms and the resulting bottom and beach erosion
or accretion will be described in the next chapter. In this chapter we will
examine the wave-induced circulation patterns that drive water and sediment
alongshore and onshore/offshore during both fair weather and storm conditions.
In Fig. 7.18 a division of the coastal zone is shown and the terminology that
describes particular sectors of the zone is given.
7.8.2 Circulation in the Surf Zone
Introduction. In the previous sections we showed that wind-driven currents
constitute a very important component of the oceanic circulation. In the proximity of a coastline, the water movement becomes restricted, leading to a rising