

4.3 Statistical and Spectral Properties of Waves
153
S/oico p )
Sloi~)
0.5
/ \
.....
0.0
0.5
1.0
1.5
2.0
2.5
Normalized frequency
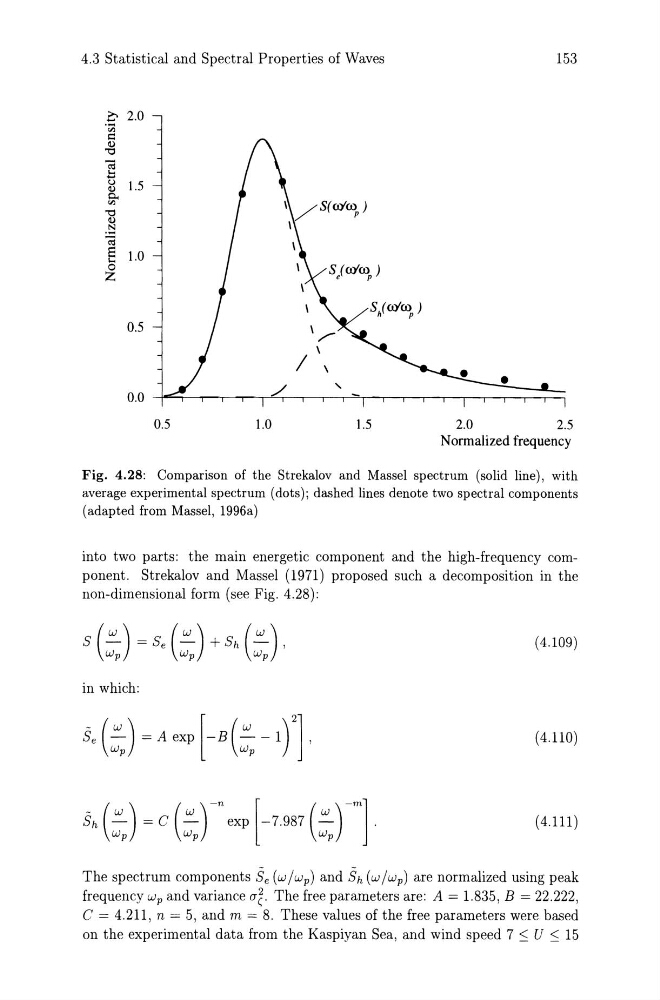
Fig. 4.28: Comparison of the Strekalov and Massel spectrum (solid line), with
average experimental spectrum (dots); dashed lines denote two spectral components
(adapted from Massel, 1996a)
into two parts: the main energetic component and the high-frequency component. Strekalov and Massel (1971) proposed such a decomposition in the
non-dimensional form (see Fig. 4.28):
(4.109)
in which:
(4.110)
Sh (:J ~ c (:J -" exp [-7.987 (:J -mj.
(4.111)
The spectrum components Be (w /w p ) and Bh (w /wp) are normalized using peak
frequency Wp and variance az, The free parameters are: A = 1.835, B = 22.222,
C = 4.211, n = 5, and m = 8. These values of the free parameters were based
on the experimental data from the Kaspiyan Sea, and wind speed 7 SUS 15
153
S/oico p )
Sloi~)
0.5
/ \
.....
0.0
0.5
1.0
1.5
2.0
2.5
Normalized frequency
Fig. 4.28: Comparison of the Strekalov and Massel spectrum (solid line), with
average experimental spectrum (dots); dashed lines denote two spectral components
(adapted from Massel, 1996a)
into two parts: the main energetic component and the high-frequency component. Strekalov and Massel (1971) proposed such a decomposition in the
non-dimensional form (see Fig. 4.28):
(4.109)
in which:
(4.110)
Sh (:J ~ c (:J -" exp [-7.987 (:J -mj.
(4.111)
The spectrum components Be (w /w p ) and Bh (w /wp) are normalized using peak
frequency Wp and variance az, The free parameters are: A = 1.835, B = 22.222,
C = 4.211, n = 5, and m = 8. These values of the free parameters were based
on the experimental data from the Kaspiyan Sea, and wind speed 7 SUS 15