

132
4 How to Determine Wave Parameters
~
............. i"-.
"
1.0
1:20
r-.
1. ~Il
-r- . . . . . . .
~
1:50
r- . . . . . . .
- r- . . . . . . .
horizt nta b tt tnn
Ison 1 994
~
-- I"-- ~ ~~ ,
0.5
0.0
0.001
0.010
0.100
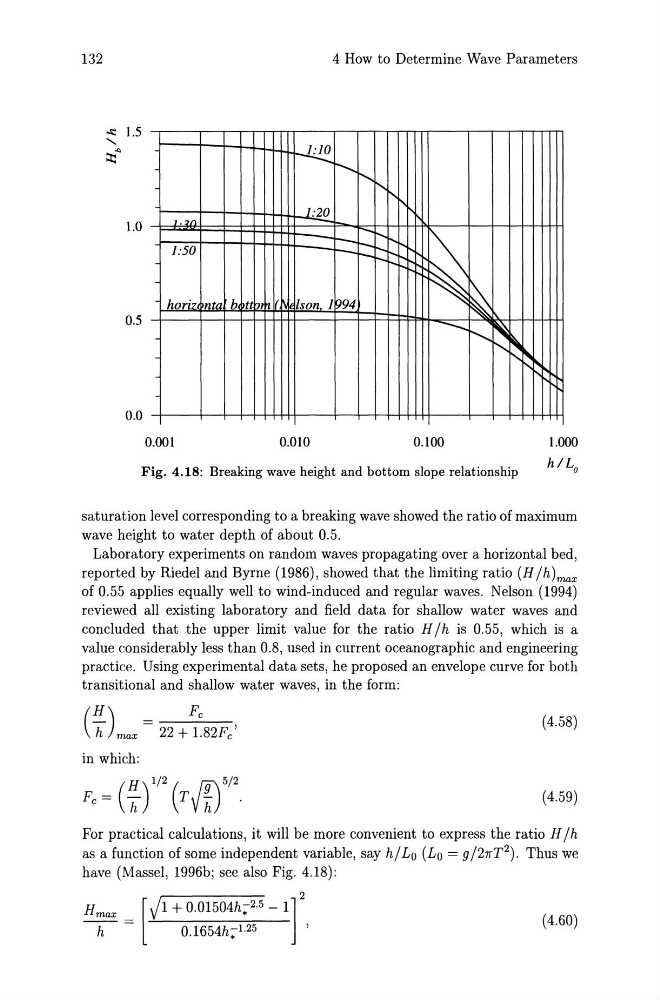
Fig. 4.18: Breaking wave height and bottom slope relationship
1.000
hiLa
saturation level corresponding to a breaking wave showed the ratio of maximum
wave height to water depth of about 0.5.
Laboratory experiments on random waves propagating over a horizontal bed,
reported by Riedel and Byrne (1986), showed that the limiting ratio (H /h)max
of 0.55 applies equally well to wind-induced and regular waves. Nelson (1994)
reviewed all existing laboratory and field data for shallow water waves and
concluded that the upper limit value for the ratio H /h is 0.55, which is a
value considerably less than 0.8, used in current oceanographic and engineering
practice. Using experimental data sets, he proposed an envelope curve for both
transitional and shallow water waves, in the form:
22 + 1. 82Fe '
( 4.58)
in which:
Fe = (~) 1/2 (T/f) 5/2
(4.59)
For practical calculations, it will be more convenient to express the ratio H / h
as a function of some independent variable, say h / La (La = g /27rT 2 ). Thus we
have (Massel, 1996b; see also Fig. 4.18):
Hmax
h
[
Jl + 0.01504h;2.5 - 1]2
0.1654h;1.25
'
(4.60)
4 How to Determine Wave Parameters
~
............. i"-.
"
1.0
1:20
r-.
1. ~Il
-r- . . . . . . .
~
1:50
r- . . . . . . .
- r- . . . . . . .
horizt nta b tt tnn
Ison 1 994
~
-- I"-- ~ ~~ ,
0.5
0.0
0.001
0.010
0.100
Fig. 4.18: Breaking wave height and bottom slope relationship
1.000
hiLa
saturation level corresponding to a breaking wave showed the ratio of maximum
wave height to water depth of about 0.5.
Laboratory experiments on random waves propagating over a horizontal bed,
reported by Riedel and Byrne (1986), showed that the limiting ratio (H /h)max
of 0.55 applies equally well to wind-induced and regular waves. Nelson (1994)
reviewed all existing laboratory and field data for shallow water waves and
concluded that the upper limit value for the ratio H /h is 0.55, which is a
value considerably less than 0.8, used in current oceanographic and engineering
practice. Using experimental data sets, he proposed an envelope curve for both
transitional and shallow water waves, in the form:
22 + 1. 82Fe '
( 4.58)
in which:
Fe = (~) 1/2 (T/f) 5/2
(4.59)
For practical calculations, it will be more convenient to express the ratio H / h
as a function of some independent variable, say h / La (La = g /27rT 2 ). Thus we
have (Massel, 1996b; see also Fig. 4.18):
Hmax
h
[
Jl + 0.01504h;2.5 - 1]2
0.1654h;1.25
'
(4.60)