

71
Chapter four: Pressure regulation
0
0
5 0
0
5 0
0
5 0
0
5 0
0
5 0
0
5 0
0
% Time at depth
50
500
1000
1500
Ziphius
16
(a)
(b)
(c)
(d)
(e)
(f )
(g)
16
14
12
Physeter
18
18
20
20
22
22
24
24
2
4
2
5
3
1
23
21
19
Globicephala
Phocoena
Mirounga
Zalophus
Arctocephalus
Depth (m)
17
15
10
6
0
2
4
6
8
10
12
14
16
4
2
24
22
20
Time (h)
18
16
14
12
8
1 0
1 2
1 4
1 6
1 8
2 0
2 2
12
14
16
18
20
22
24
4
6
0
500
1000
1500
0
500
1000
1500
0
500
1000
1500
0
500
1000
1500
0
500
1000
1500
0
500
1000
1500
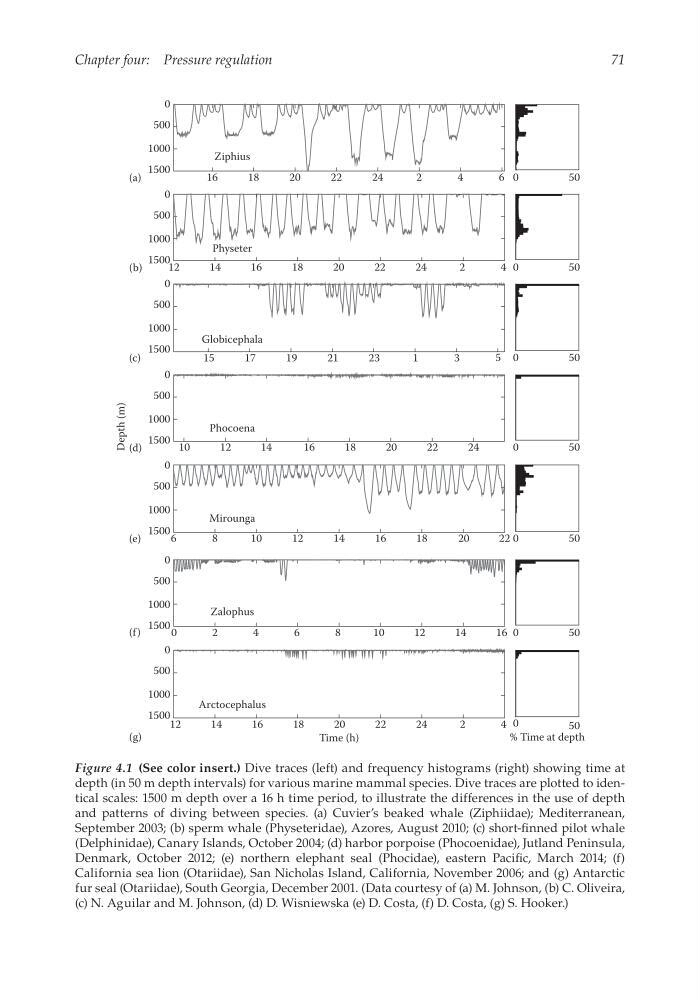
Figure 4.1 (See color insert.) Dive traces (left) and frequency histograms (right) showing time at
depth (in 50 m depth intervals) for various marine mammal species. Dive traces are plotted to identical scales: 1500 m depth over a 16 h time period, to illustrate the differences in the use of depth
and patterns of diving between species. (a) Cuvier’s beaked whale (Ziphiidae); Mediterranean,
September 2003; (b) sperm whale (Physeteridae), Azores, August 2010; (c) short-finned pilot whale
(Delphinidae), Canary Islands, October 2004; (d) harbor porpoise (Phocoenidae), Jutland Peninsula,
Denmark, October 2012; (e) northern elephant seal (Phocidae), eastern Pacific, March 2014; (f)
California sea lion (Otariidae), San Nicholas Island, California, November 2006; and (g) Antarctic
fur seal (Otariidae), South Georgia, December 2001. (Data courtesy of (a) M. Johnson, (b) C. Oliveira,
(c) N. Aguilar and M. Johnson, (d) D. Wisniewska (e) D. Costa, (f) D. Costa, (g) S. Hooker.)
Chapter four: Pressure regulation
0
0
5 0
0
5 0
0
5 0
0
5 0
0
5 0
0
5 0
0
% Time at depth
50
500
1000
1500
Ziphius
16
(a)
(b)
(c)
(d)
(e)
(f )
(g)
16
14
12
Physeter
18
18
20
20
22
22
24
24
2
4
2
5
3
1
23
21
19
Globicephala
Phocoena
Mirounga
Zalophus
Arctocephalus
Depth (m)
17
15
10
6
0
2
4
6
8
10
12
14
16
4
2
24
22
20
Time (h)
18
16
14
12
8
1 0
1 2
1 4
1 6
1 8
2 0
2 2
12
14
16
18
20
22
24
4
6
0
500
1000
1500
0
500
1000
1500
0
500
1000
1500
0
500
1000
1500
0
500
1000
1500
0
500
1000
1500
Figure 4.1 (See color insert.) Dive traces (left) and frequency histograms (right) showing time at
depth (in 50 m depth intervals) for various marine mammal species. Dive traces are plotted to identical scales: 1500 m depth over a 16 h time period, to illustrate the differences in the use of depth
and patterns of diving between species. (a) Cuvier’s beaked whale (Ziphiidae); Mediterranean,
September 2003; (b) sperm whale (Physeteridae), Azores, August 2010; (c) short-finned pilot whale
(Delphinidae), Canary Islands, October 2004; (d) harbor porpoise (Phocoenidae), Jutland Peninsula,
Denmark, October 2012; (e) northern elephant seal (Phocidae), eastern Pacific, March 2014; (f)
California sea lion (Otariidae), San Nicholas Island, California, November 2006; and (g) Antarctic
fur seal (Otariidae), South Georgia, December 2001. (Data courtesy of (a) M. Johnson, (b) C. Oliveira,
(c) N. Aguilar and M. Johnson, (d) D. Wisniewska (e) D. Costa, (f) D. Costa, (g) S. Hooker.)