

0.1
Bottlenose dolphin
Threshold (dB re 1 µPa)
False killer whale
Killer whale
Beluga
Amazon River dolphin
Harbor porpoise
Blainville’s beaked whale
20
40
60
80
100
120
140
1
Frequency (kHz)
10
100
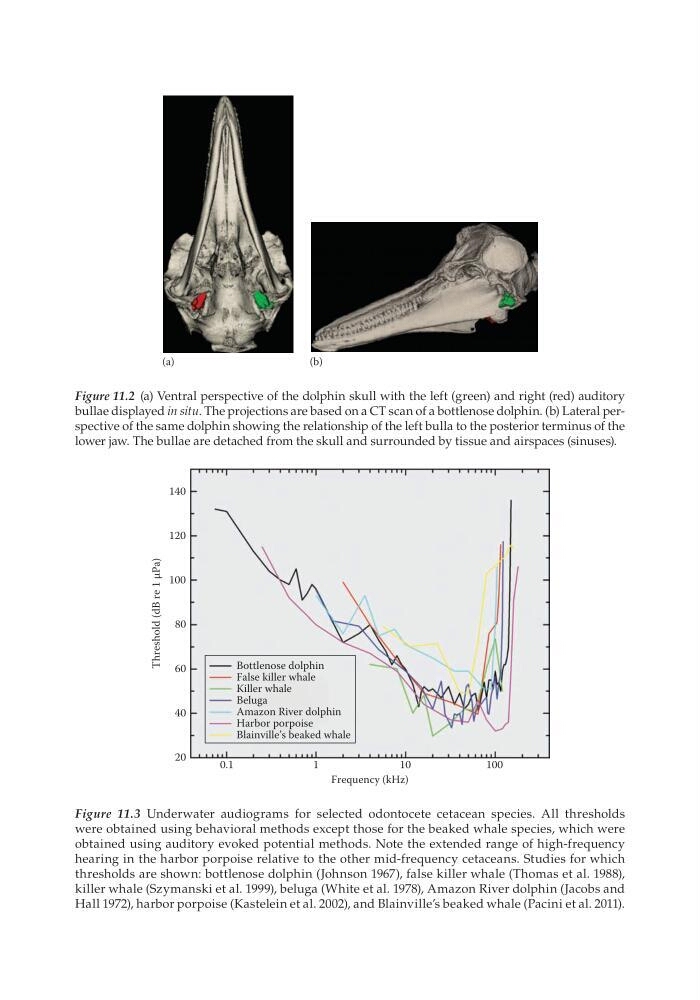
Figure 11.3 Underwater audiograms for selected odontocete cetacean species. All thresholds
were obtained using behavioral methods except those for the beaked whale species, which were
obtained using auditory evoked potential methods. Note the extended range of high-frequency
hearing in the harbor porpoise relative to the other mid-frequency cetaceans. Studies for which
thresholds are shown: bottlenose dolphin (Johnson 1967), false killer whale (Thomas et al. 1988),
killer whale (Szymanski et al. 1999), beluga (White et al. 1978), Amazon River dolphin (Jacobs and
Hall 1972), harbor porpoise (Kastelein et al. 2002), and Blainville’s beaked whale (Pacini et al. 2011).
(a)
(b)
Figure 11.2 (a) Ventral perspective of the dolphin skull with the left (green) and right (red) auditory
bullae displayed in situ. The projections are based on a CT scan of a bottlenose dolphin. (b) Lateral perspective of the same dolphin showing the relationship of the left bulla to the posterior terminus of the
lower jaw. The bullae are detached from the skull and surrounded by t issue and airspaces (sinuses).
Bottlenose dolphin
Threshold (dB re 1 µPa)
False killer whale
Killer whale
Beluga
Amazon River dolphin
Harbor porpoise
Blainville’s beaked whale
20
40
60
80
100
120
140
1
Frequency (kHz)
10
100
Figure 11.3 Underwater audiograms for selected odontocete cetacean species. All thresholds
were obtained using behavioral methods except those for the beaked whale species, which were
obtained using auditory evoked potential methods. Note the extended range of high-frequency
hearing in the harbor porpoise relative to the other mid-frequency cetaceans. Studies for which
thresholds are shown: bottlenose dolphin (Johnson 1967), false killer whale (Thomas et al. 1988),
killer whale (Szymanski et al. 1999), beluga (White et al. 1978), Amazon River dolphin (Jacobs and
Hall 1972), harbor porpoise (Kastelein et al. 2002), and Blainville’s beaked whale (Pacini et al. 2011).
(a)
(b)
Figure 11.2 (a) Ventral perspective of the dolphin skull with the left (green) and right (red) auditory
bullae displayed in situ. The projections are based on a CT scan of a bottlenose dolphin. (b) Lateral perspective of the same dolphin showing the relationship of the left bulla to the posterior terminus of the
lower jaw. The bullae are detached from the skull and surrounded by t issue and airspaces (sinuses).