

142
Marine Mammal Physiology: Requisites for Ocean Living
to excrete more salt with less water to maintain homeostasis. This process is facilitated by
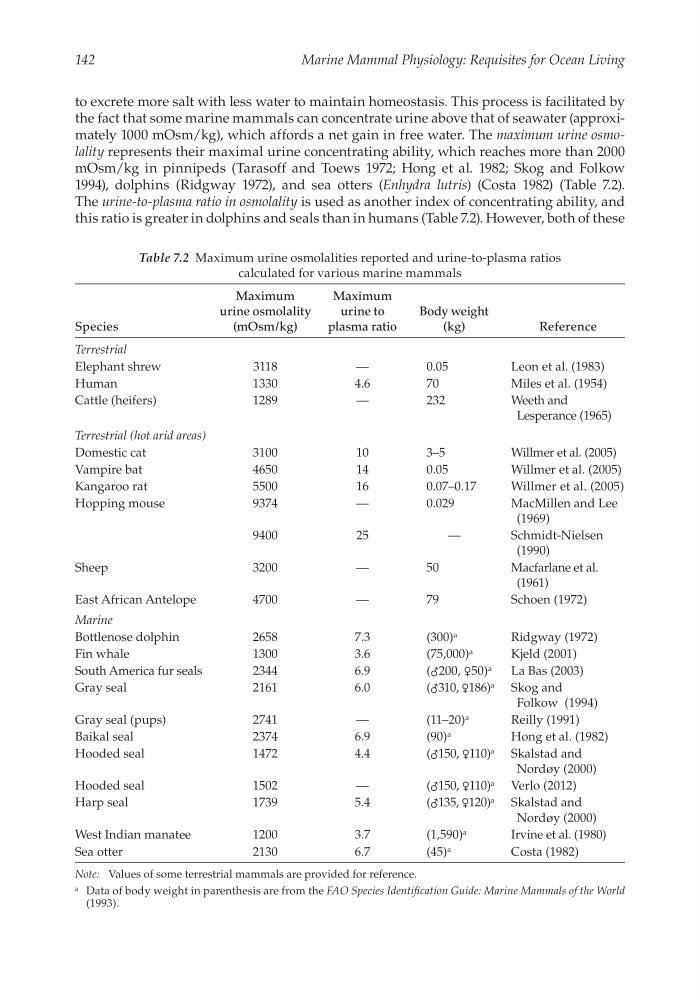
the fact that some marine mammals can concentrate urine above that of seawater (approximately 1000 mOsm/kg), which affords a net gain in free water. The maximum urine osmolality represents their maximal urine concentrating ability, which reaches more than 2000
mOsm/kg in pinnipeds (Tarasoff and Toews 1972; Hong et al. 1982; Skog and Folkow
1994), dolphins (Ridgway 1972), and sea otters (Enhydra lutris) (Costa 1982) (Table 7.2).
The urine-to-plasma ratio in osmolality is used as another index of concentrating ability, and
this ratio is greater in dolphins and seals than in humans (Table 7.2). However, both of these
Table 7.2 Maximum urine osmolalities reported and urine-to-plasma ratios
calculated for various marine mammals
Species
Maximum
urine osmolality
(mOsm/kg)
Maximum
urine to
plasma ratio
Body weight
(kg)
Reference
Terrestrial
Elephant shrew
3118
—
0.05
Leon et al. (1983)
Human
1330
4.6
70
Miles et al. (1954)
Cattle (heifers)
1289
—
232
Weeth and
Lesperance (1965)
Terrestrial (hot arid areas)
Domestic cat
3100
10
3–5
Willmer et al. (2005)
Vampire bat
4650
14
0.05
Willmer et al. (2005)
Kangaroo rat
5500
16
0.07–0.17
Willmer et al. (2005)
Hopping mouse
9374
—
0.029
MacMillen and Lee
(1969)
9400
25
—
Schmidt-Nielsen
(1990)
Sheep
3200
—
50
Macfarlane et al.
(1961)
East African Antelope
4700
—
79
Schoen (1972)
Marine
Bottlenose dolphin
2658
7.3
(300) a
Ridgway (1972)
Fin whale
1300
3.6
(75,000) a
Kjeld (2001)
South America fur seals
2344
6.9
(♂200, ♀50) a
La Bas (2003)
Gray seal
2161
6.0
(♂310, ♀186) a Skog and
Folkow (1994)
Gray seal (pups)
2741
—
(11–20) a
Reilly (1991)
Baikal seal
2374
6.9
(90) a
Hong et al. (1982)
Hooded seal
1472
4.4
(♂150, ♀110) a Skalstad and
Nordøy (2000)
Hooded seal
1502
—
(♂150, ♀110) a Verlo (2012)
Harp seal
1739
5.4
(♂135, ♀120) a Skalstad and
Nordøy (2000)
West Indian manatee
1200
3.7
(1,590) a
Irvine et al. (1980)
Sea otter
2130
6.7
(45) a
Costa (1982)
Note: Values of some terrestrial mammals are provided for reference.
a Data of body weight in parenthesis are from the FAO Species Identification Guide: Marine Mammals of the World
(1993).
Marine Mammal Physiology: Requisites for Ocean Living
to excrete more salt with less water to maintain homeostasis. This process is facilitated by
the fact that some marine mammals can concentrate urine above that of seawater (approximately 1000 mOsm/kg), which affords a net gain in free water. The maximum urine osmolality represents their maximal urine concentrating ability, which reaches more than 2000
mOsm/kg in pinnipeds (Tarasoff and Toews 1972; Hong et al. 1982; Skog and Folkow
1994), dolphins (Ridgway 1972), and sea otters (Enhydra lutris) (Costa 1982) (Table 7.2).
The urine-to-plasma ratio in osmolality is used as another index of concentrating ability, and
this ratio is greater in dolphins and seals than in humans (Table 7.2). However, both of these
Table 7.2 Maximum urine osmolalities reported and urine-to-plasma ratios
calculated for various marine mammals
Species
Maximum
urine osmolality
(mOsm/kg)
Maximum
urine to
plasma ratio
Body weight
(kg)
Reference
Terrestrial
Elephant shrew
3118
—
0.05
Leon et al. (1983)
Human
1330
4.6
70
Miles et al. (1954)
Cattle (heifers)
1289
—
232
Weeth and
Lesperance (1965)
Terrestrial (hot arid areas)
Domestic cat
3100
10
3–5
Willmer et al. (2005)
Vampire bat
4650
14
0.05
Willmer et al. (2005)
Kangaroo rat
5500
16
0.07–0.17
Willmer et al. (2005)
Hopping mouse
9374
—
0.029
MacMillen and Lee
(1969)
9400
25
—
Schmidt-Nielsen
(1990)
Sheep
3200
—
50
Macfarlane et al.
(1961)
East African Antelope
4700
—
79
Schoen (1972)
Marine
Bottlenose dolphin
2658
7.3
(300) a
Ridgway (1972)
Fin whale
1300
3.6
(75,000) a
Kjeld (2001)
South America fur seals
2344
6.9
(♂200, ♀50) a
La Bas (2003)
Gray seal
2161
6.0
(♂310, ♀186) a Skog and
Folkow (1994)
Gray seal (pups)
2741
—
(11–20) a
Reilly (1991)
Baikal seal
2374
6.9
(90) a
Hong et al. (1982)
Hooded seal
1472
4.4
(♂150, ♀110) a Skalstad and
Nordøy (2000)
Hooded seal
1502
—
(♂150, ♀110) a Verlo (2012)
Harp seal
1739
5.4
(♂135, ♀120) a Skalstad and
Nordøy (2000)
West Indian manatee
1200
3.7
(1,590) a
Irvine et al. (1980)
Sea otter
2130
6.7
(45) a
Costa (1982)
Note: Values of some terrestrial mammals are provided for reference.
a Data of body weight in parenthesis are from the FAO Species Identification Guide: Marine Mammals of the World
(1993).