

106
The Biology of Sea Turtles, Vol. II
Despite this relatively narrow range, the variation associated with reported
pivotal temperatures often makes it difficult to assign a specific pivotal temperature
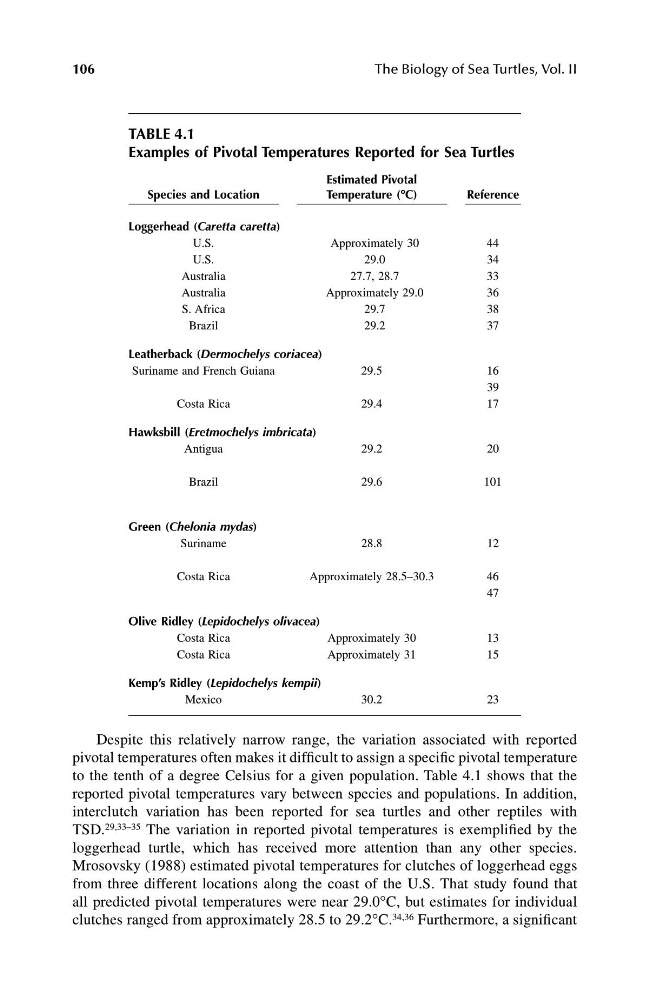
to the tenth of a degree Celsius for a given population. Table 4.1 shows that the
reported pivotal temperatures vary between species and populations. In addition,
interclutch variation has been reported for sea turtles and other reptiles with
TSD. 29,33–35 The variation in reported pivotal temperatures is exemplified by the
loggerhead turtle, which has received more attention than any other species.
Mrosovsky (1988) estimated pivotal temperatures for clutches of loggerhead eggs
from three different locations along the coast of the U.S. That study found that
all predicted pivotal temperatures were near 29.0 ∞ C, but estimates for individual
clutches ranged from approximately 28.5 to 29.2 ∞ C. 34,36 Furthermore, a significant
TABLE 4.1
Examples of Pivotal Temperatures Reported for Sea Turtles
Species and Location
Estimated Pivotal
Temperature ( ∞ ∞ ∞
∞ C)
Reference
Loggerhead ( Caretta caretta )
U.S.
Approximately 30
44
U.S.
29.0
34
Australia
27.7, 28.7
33
Australia
Approximately 29.0
36
S. Africa
29.7
38
Brazil
29.2
37
Leatherback ( Dermochelys coriacea )
Suriname and French Guiana
29.5
16
39
Costa Rica
29.4
17
Hawksbill ( Eretmochelys imbricata )
Antigua
29.2
20
Brazil
29.6
101
Green ( Chelonia mydas )
Suriname
28.8
12
Costa Rica
Approximately 28.5–30.3
46
47
Olive Ridley ( Lepidochelys olivacea )
Costa Rica
Approximately 30
13
Costa Rica
Approximately 31
15
Kemp’s Ridley ( Lepidochelys kempii )
Mexico
30.2
23
1123 book.book Page 106 Monday, November 11, 2002 11:11 AM
The Biology of Sea Turtles, Vol. II
Despite this relatively narrow range, the variation associated with reported
pivotal temperatures often makes it difficult to assign a specific pivotal temperature
to the tenth of a degree Celsius for a given population. Table 4.1 shows that the
reported pivotal temperatures vary between species and populations. In addition,
interclutch variation has been reported for sea turtles and other reptiles with
TSD. 29,33–35 The variation in reported pivotal temperatures is exemplified by the
loggerhead turtle, which has received more attention than any other species.
Mrosovsky (1988) estimated pivotal temperatures for clutches of loggerhead eggs
from three different locations along the coast of the U.S. That study found that
all predicted pivotal temperatures were near 29.0 ∞ C, but estimates for individual
clutches ranged from approximately 28.5 to 29.2 ∞ C. 34,36 Furthermore, a significant
TABLE 4.1
Examples of Pivotal Temperatures Reported for Sea Turtles
Species and Location
Estimated Pivotal
Temperature ( ∞ ∞ ∞
∞ C)
Reference
Loggerhead ( Caretta caretta )
U.S.
Approximately 30
44
U.S.
29.0
34
Australia
27.7, 28.7
33
Australia
Approximately 29.0
36
S. Africa
29.7
38
Brazil
29.2
37
Leatherback ( Dermochelys coriacea )
Suriname and French Guiana
29.5
16
39
Costa Rica
29.4
17
Hawksbill ( Eretmochelys imbricata )
Antigua
29.2
20
Brazil
29.6
101
Green ( Chelonia mydas )
Suriname
28.8
12
Costa Rica
Approximately 28.5–30.3
46
47
Olive Ridley ( Lepidochelys olivacea )
Costa Rica
Approximately 30
13
Costa Rica
Approximately 31
15
Kemp’s Ridley ( Lepidochelys kempii )
Mexico
30.2
23
1123 book.book Page 106 Monday, November 11, 2002 11:11 AM